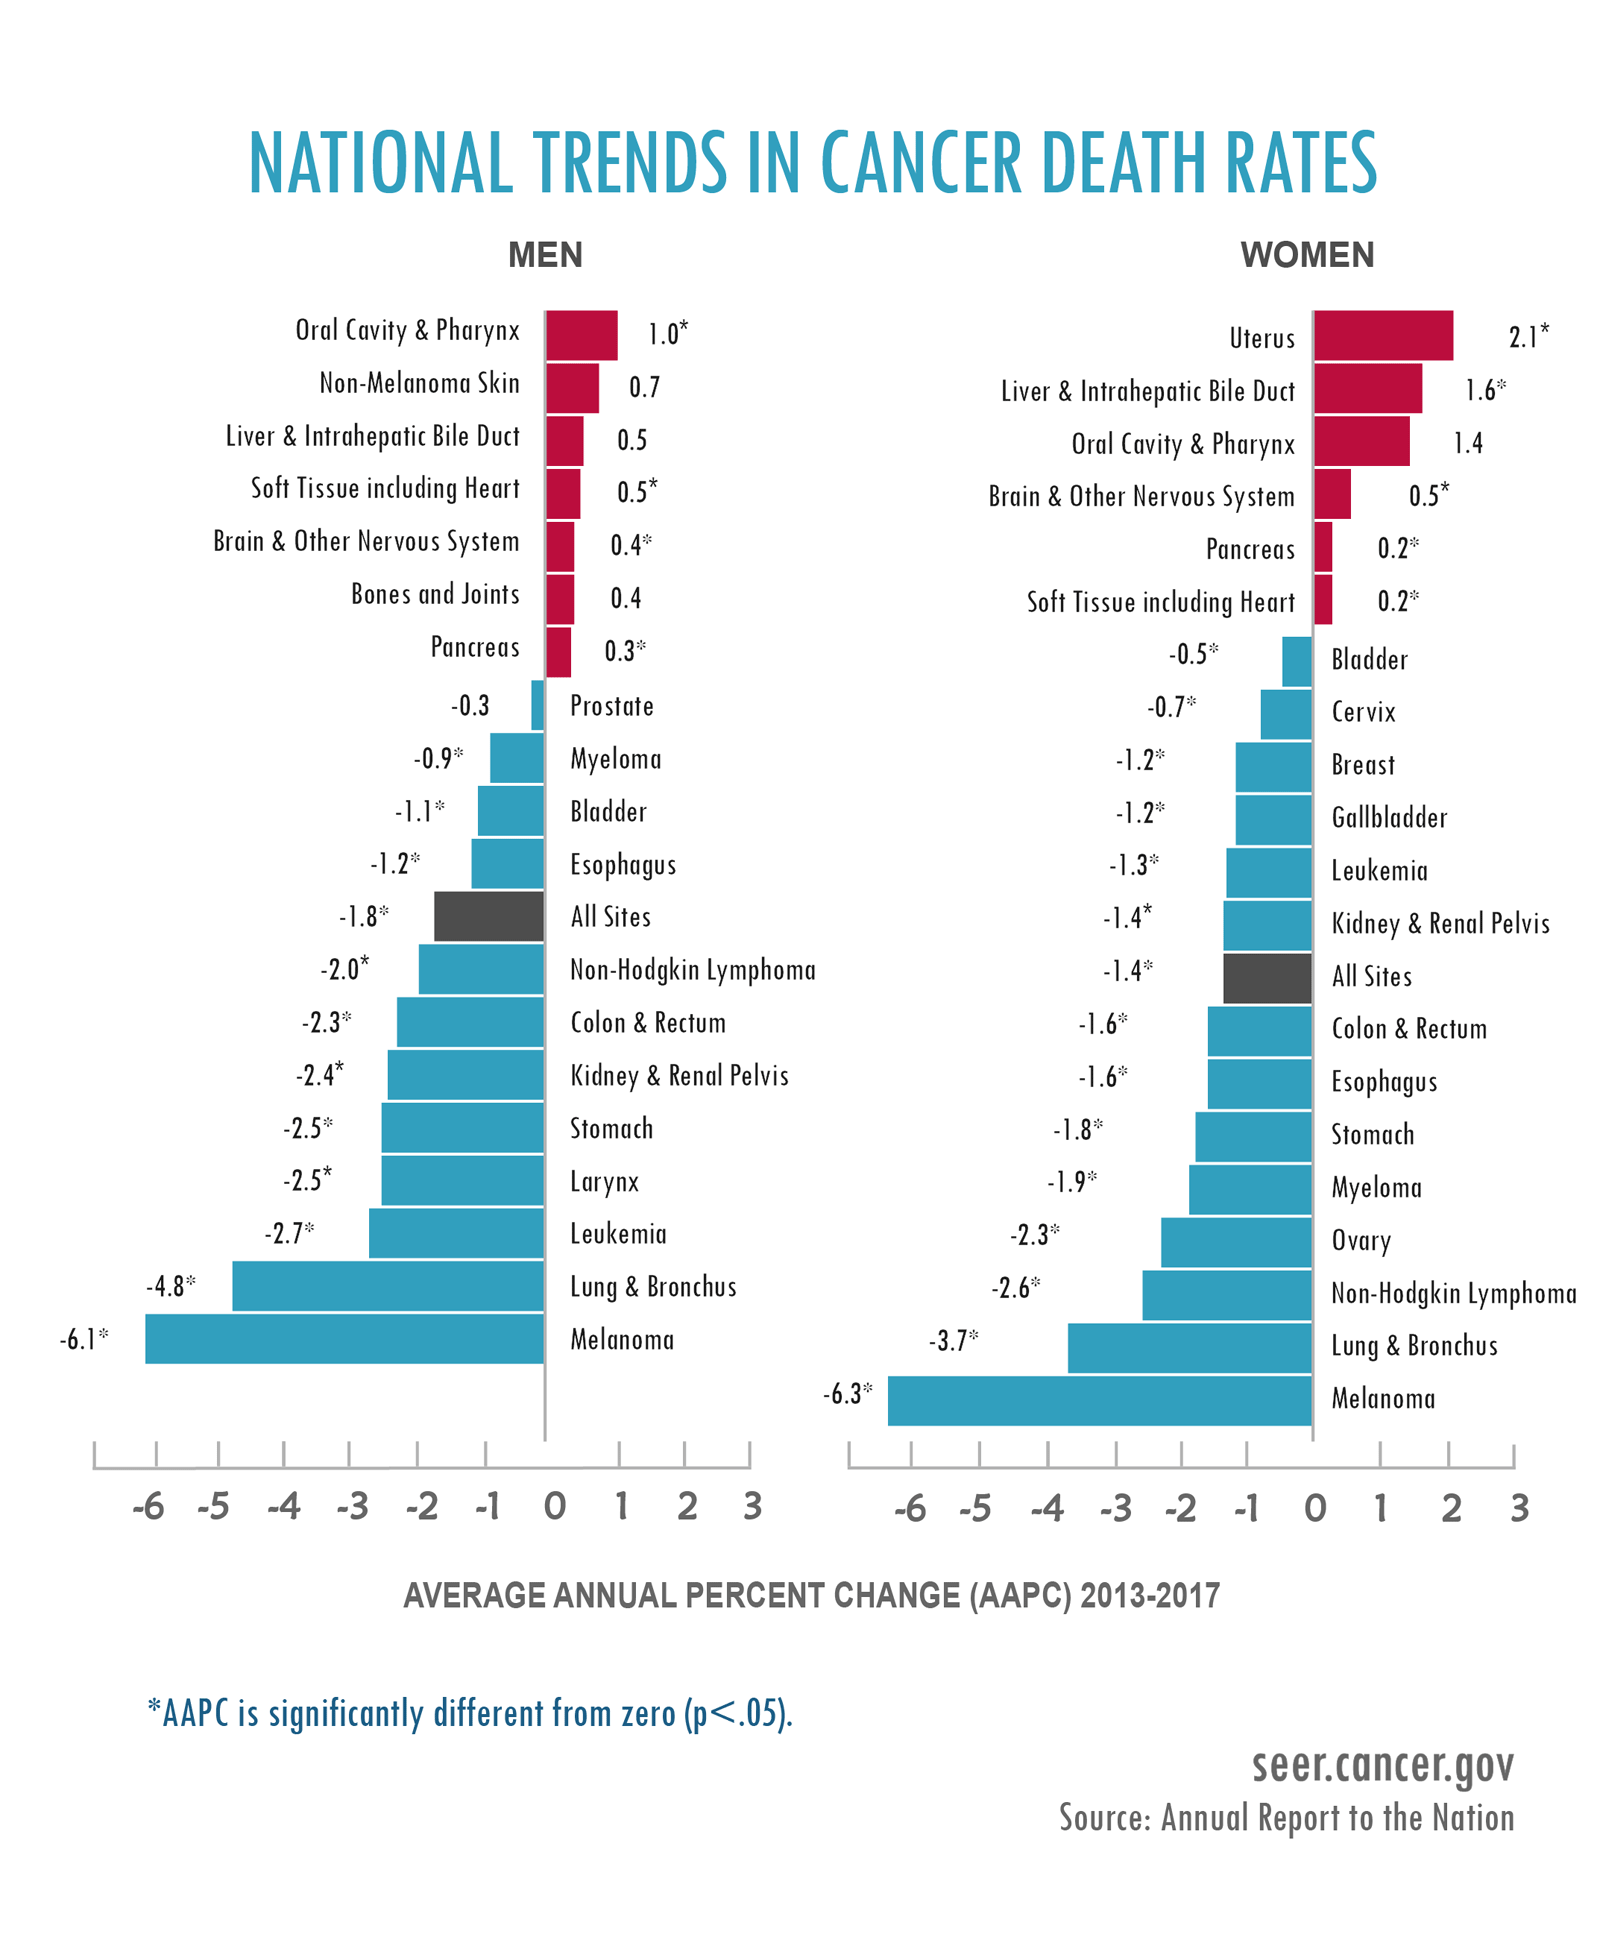
Prevention and Screening Drive Drop in Cancer Deaths
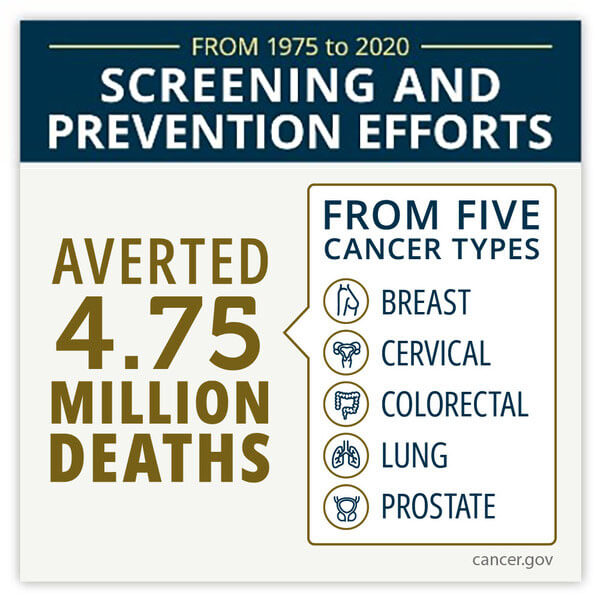
Annual Report to the Nation on the Status of Cancer, Part 1
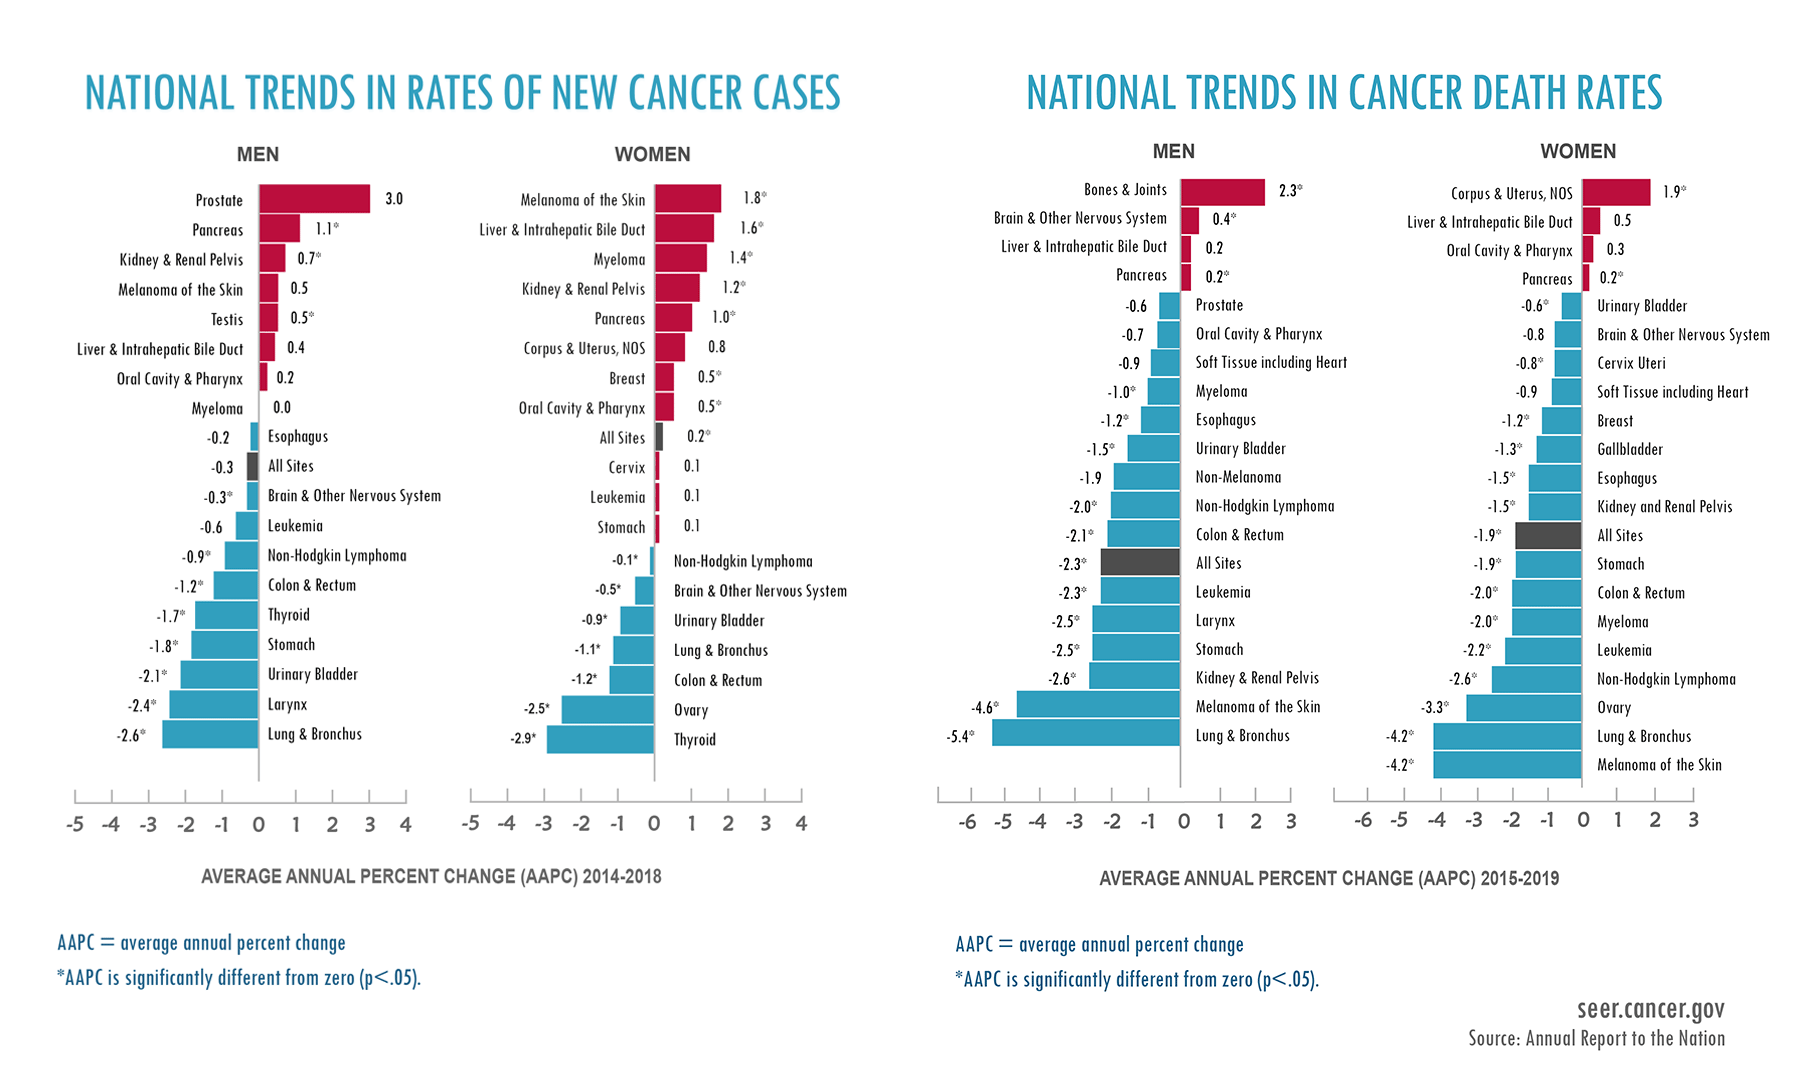
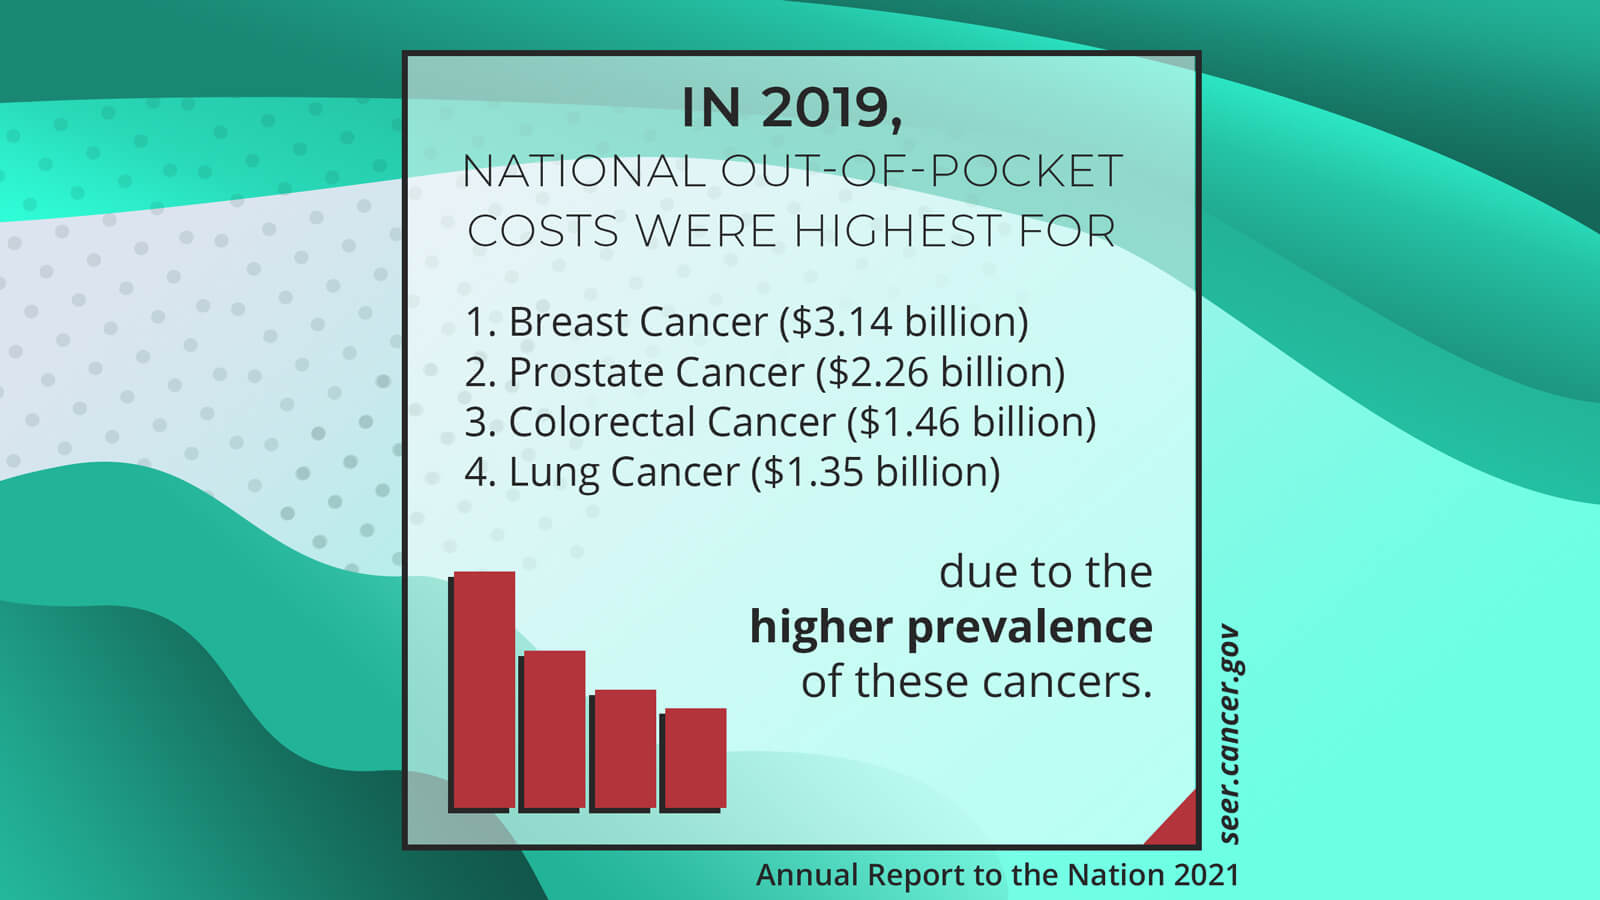
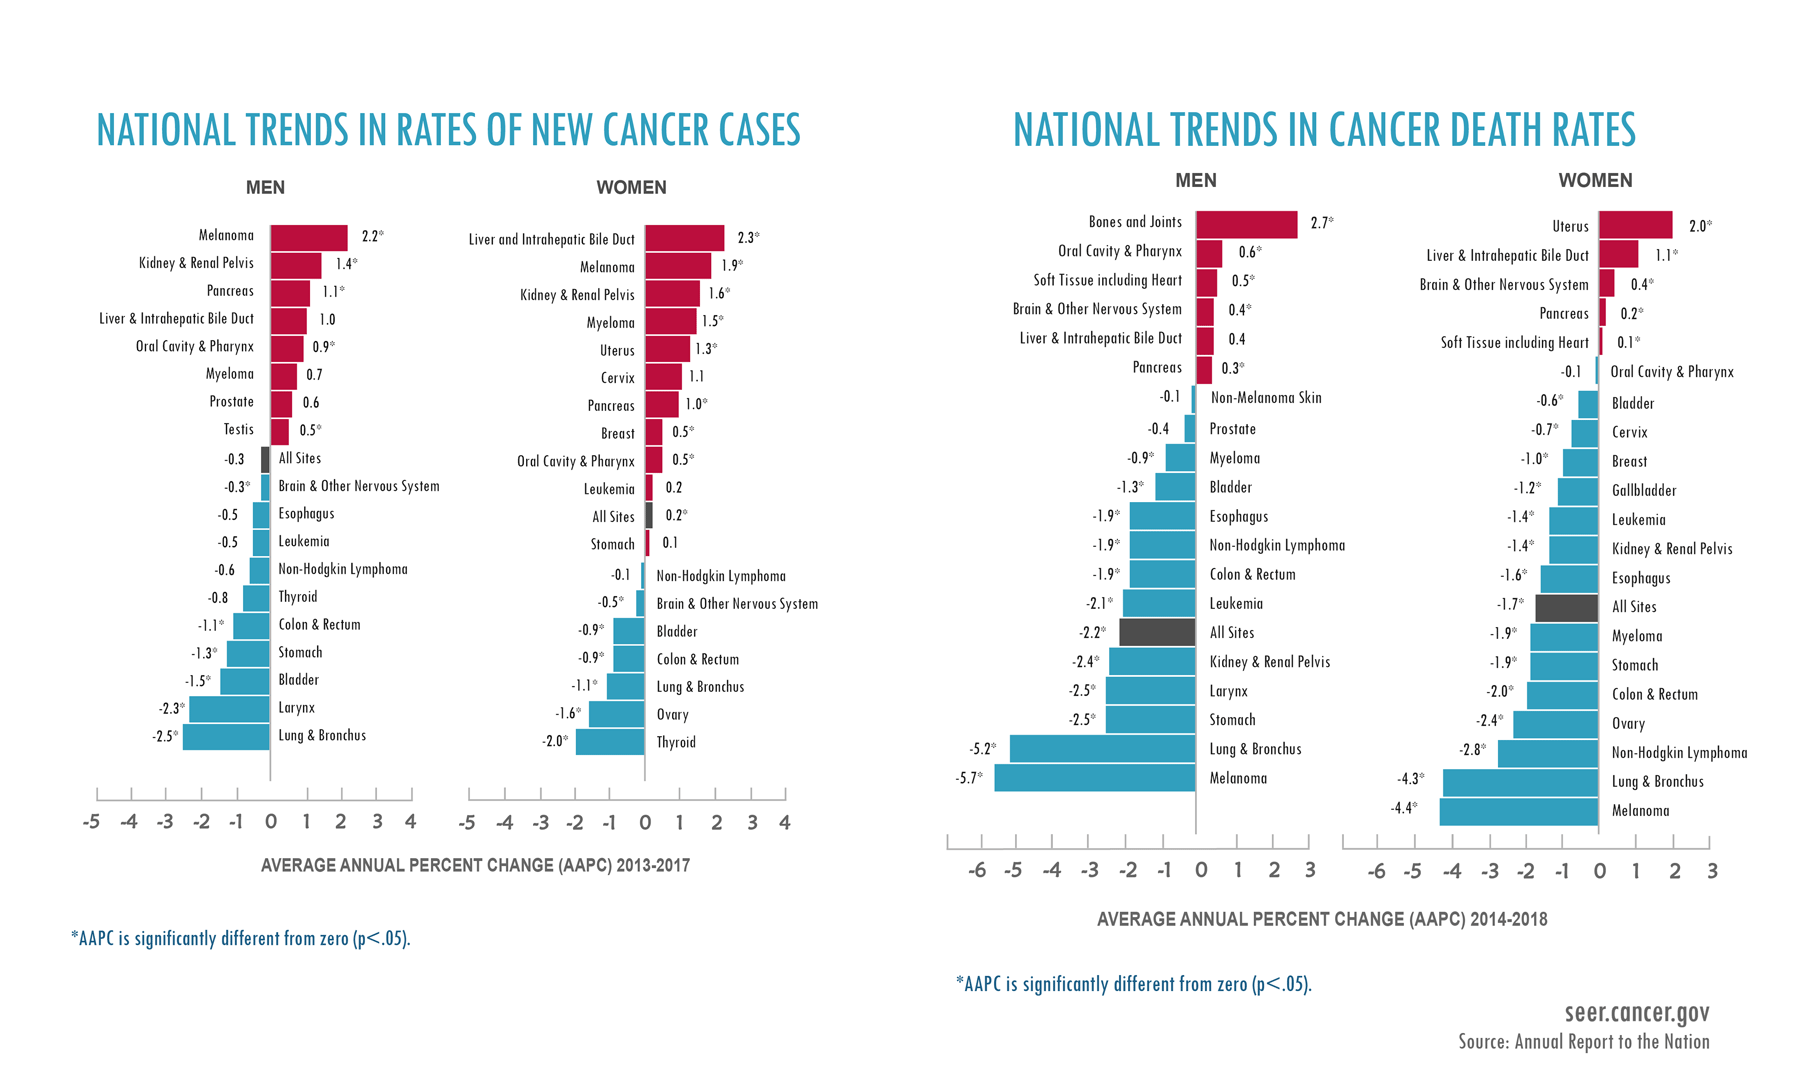
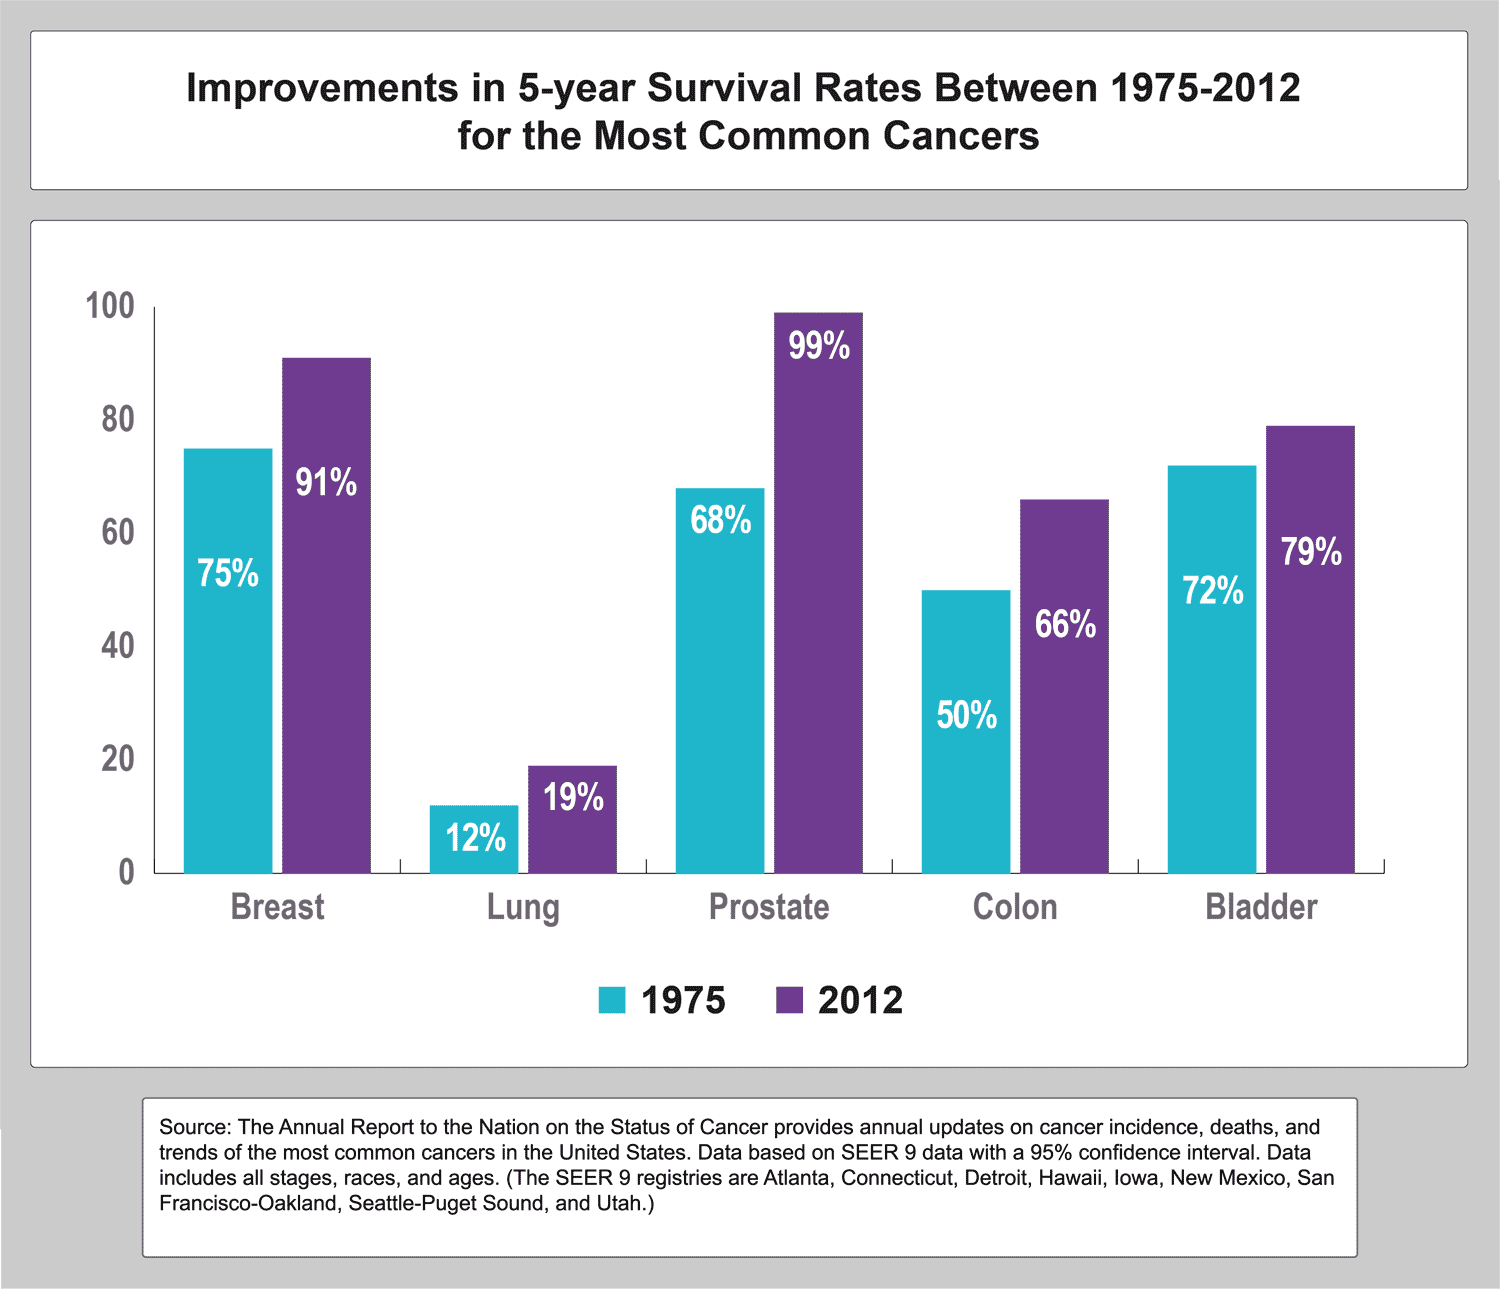
Source: Annual Report to the Nation
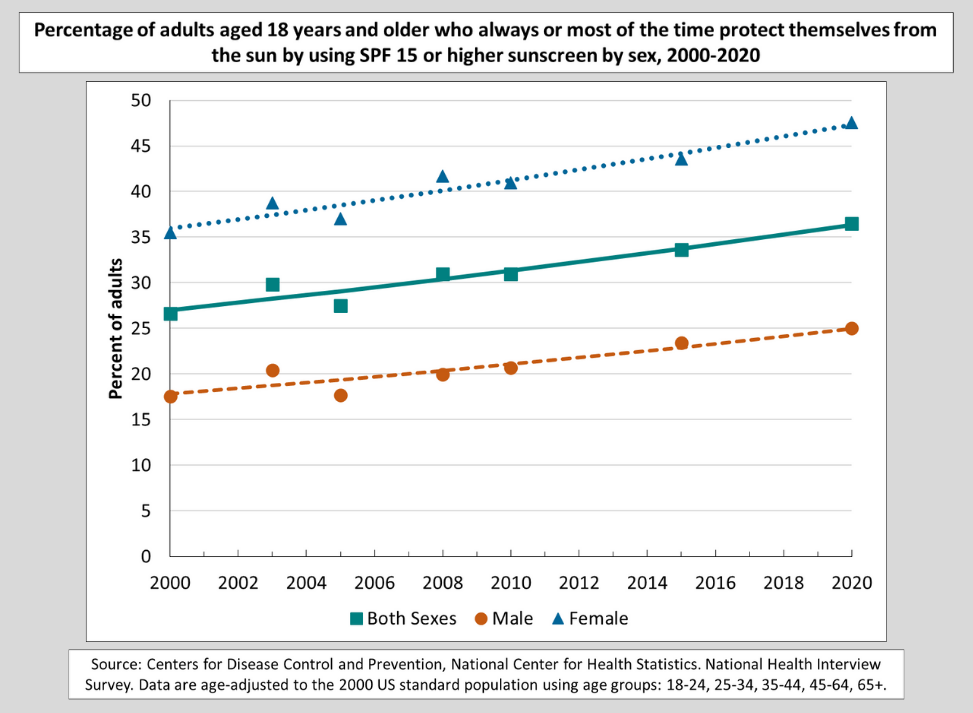
Cancer Trends Progress Report: Sun-Protective Behavior
HINTS Brief 48: Clinical Trial Participation Among U.S. Adults
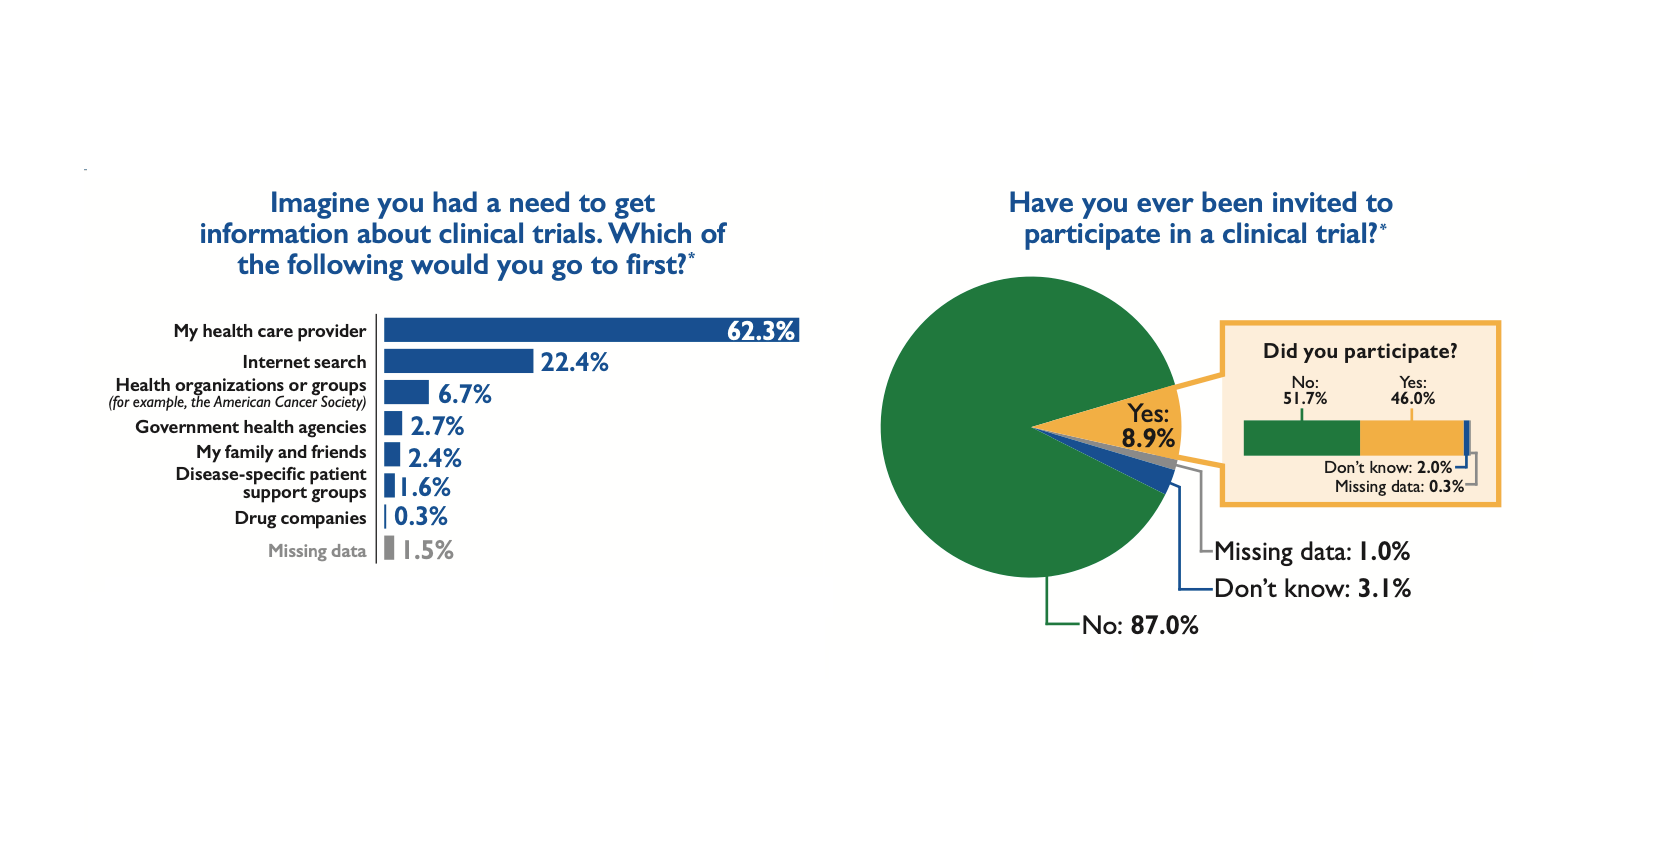
Source: HINTS Brief 48
Annual Report to the Nation Part 2
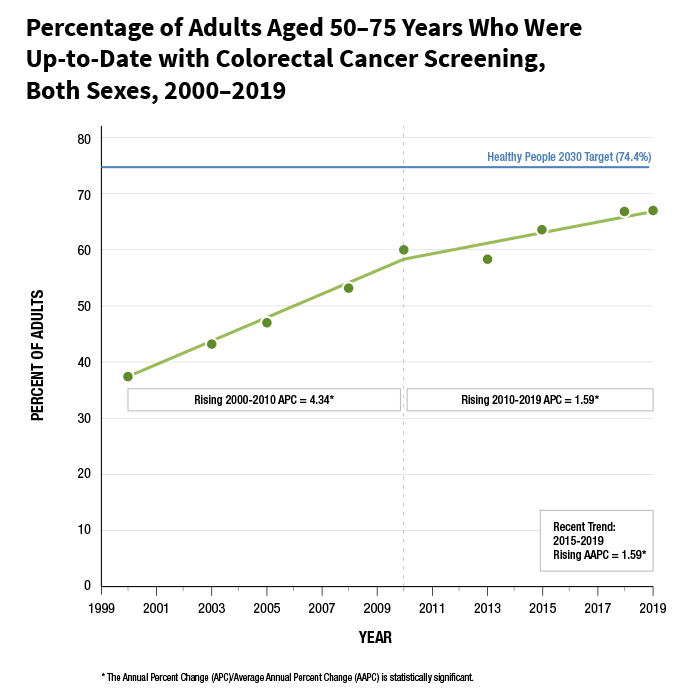
Percentage of Adults Aged 50-75 Years Who Were Up-to-Date with Colorectal Cancer Screening, Both Sexes, 2000-2019
Annual Report to the Nation on the Status of Cancer
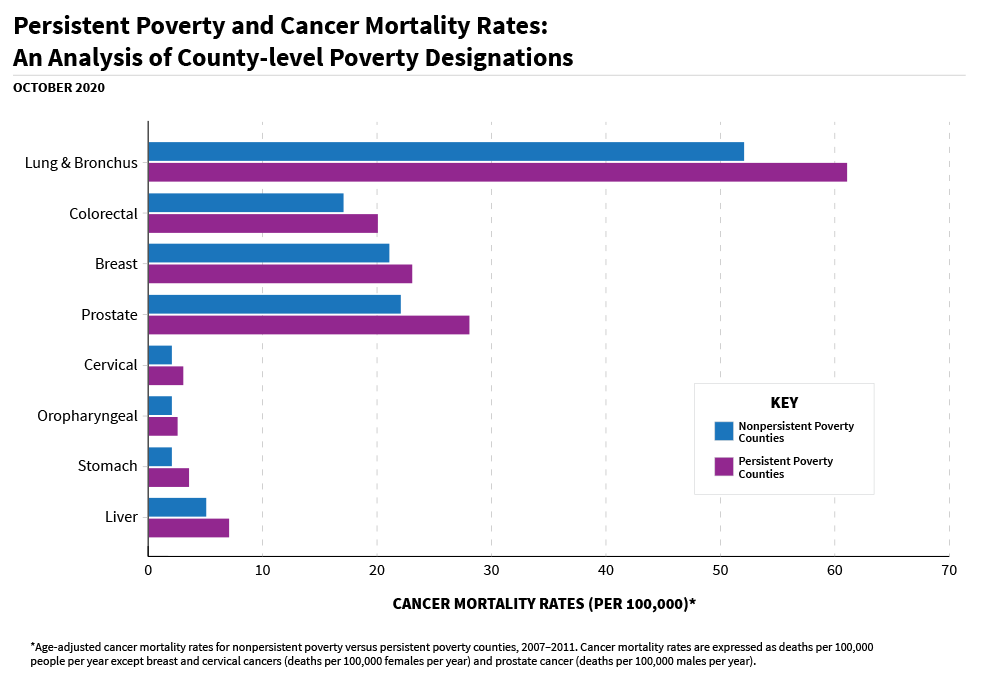
Persistent Poverty and Cancer Mortality Rates: An Analysis of County-level Poverty Designations
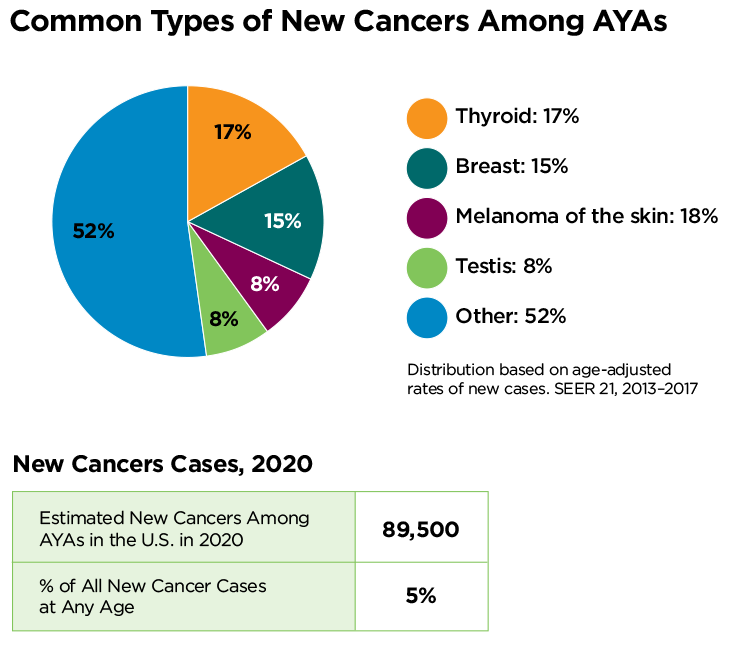
Cancer Stat Facts: Cancer Among Adolescents and Young Adults (AYAs) (Ages 15–39)
Non-Small Cell Lung Cancer (NSCLC) Survival Trends by Race-ethnicity and Gender, SEER-18 excluding Alaska. 2001-2016.
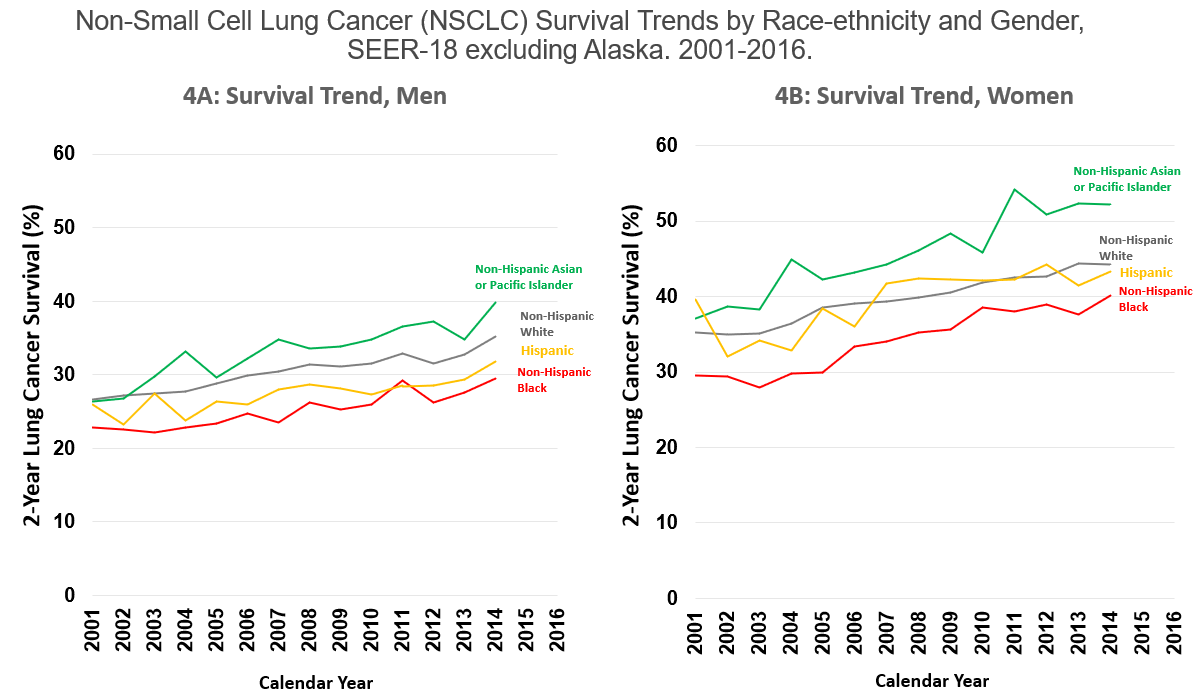
From Howlader N et al. The Impact of advances in lung cancer treatment on population mortality by subtype. NEJM 2020.
Non-Small Cell Lung Cancer (NSCLC) Survival Trends by Race-ethnicity and Gender, SEER-18 excluding Alaska. 2001-2016.

Howlader N, et al. N Engl J Med 2020; 383:640-649
https://www.cancer.gov/news-events/press-releases/2020/lung-cancer-treatments-mortality-drop?cid=eb_govdel
Annual Report to the Nation on the Status of Cancer
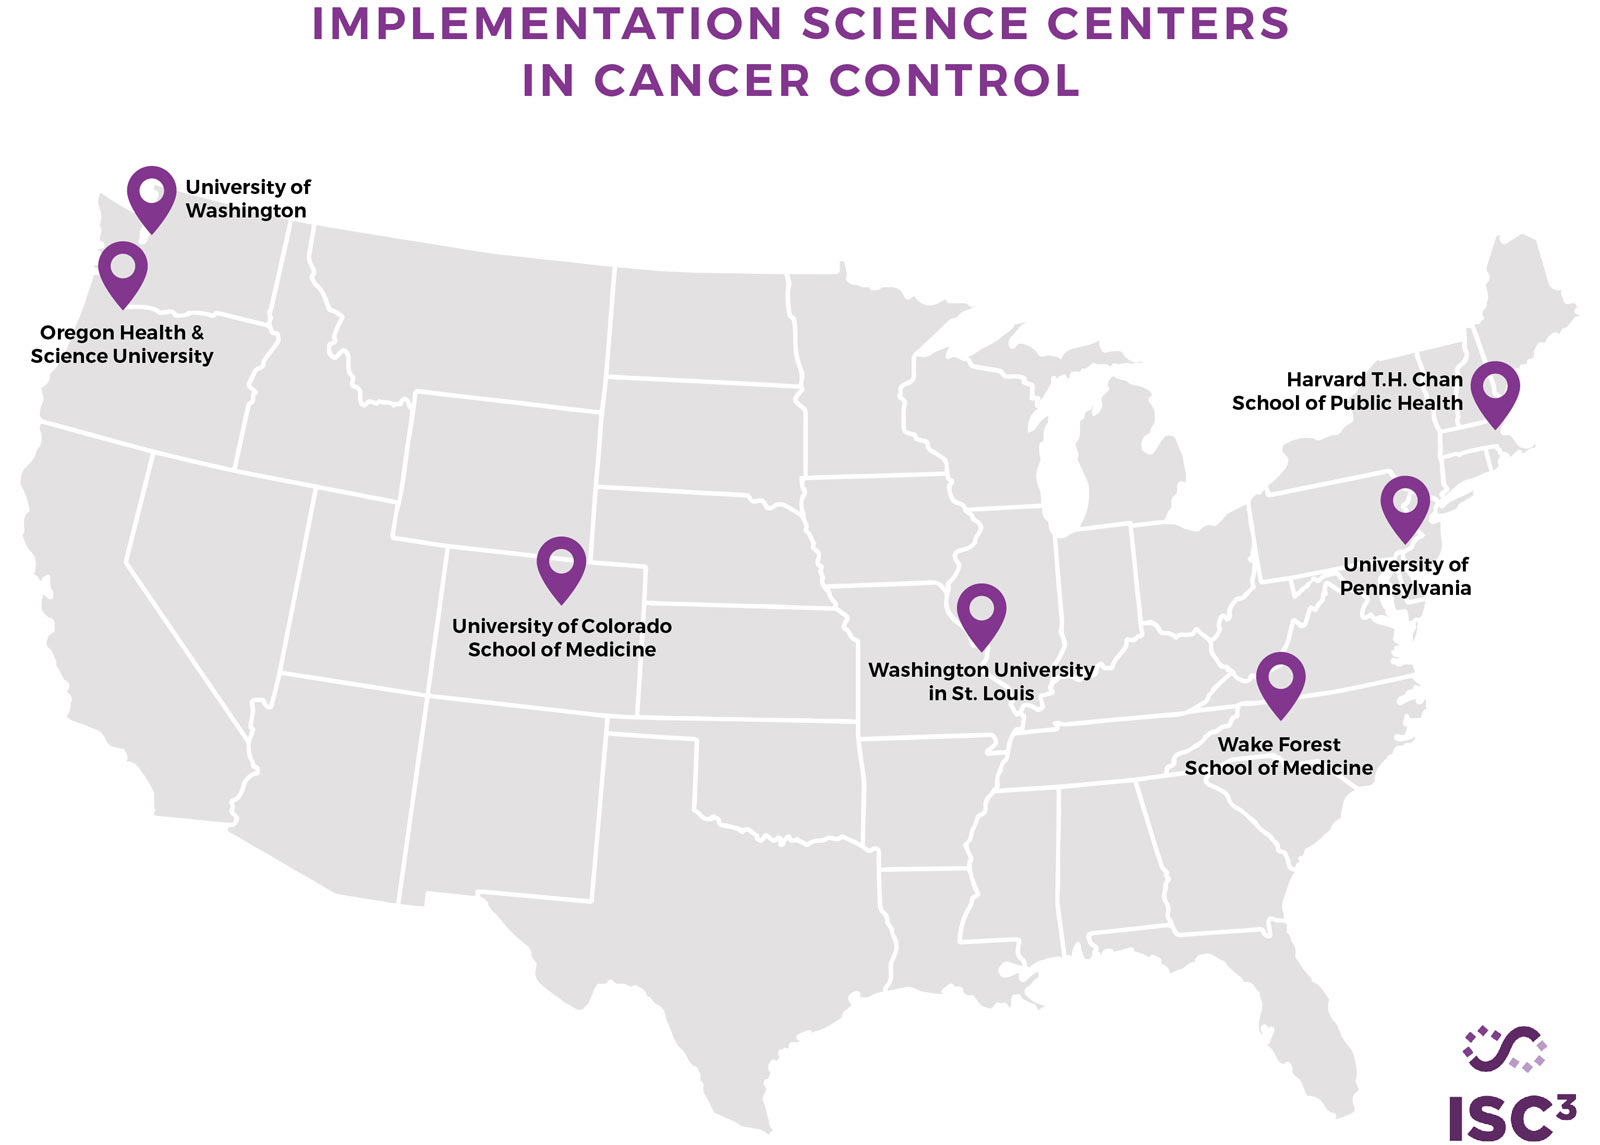
Implementation Science Centers (P50s)
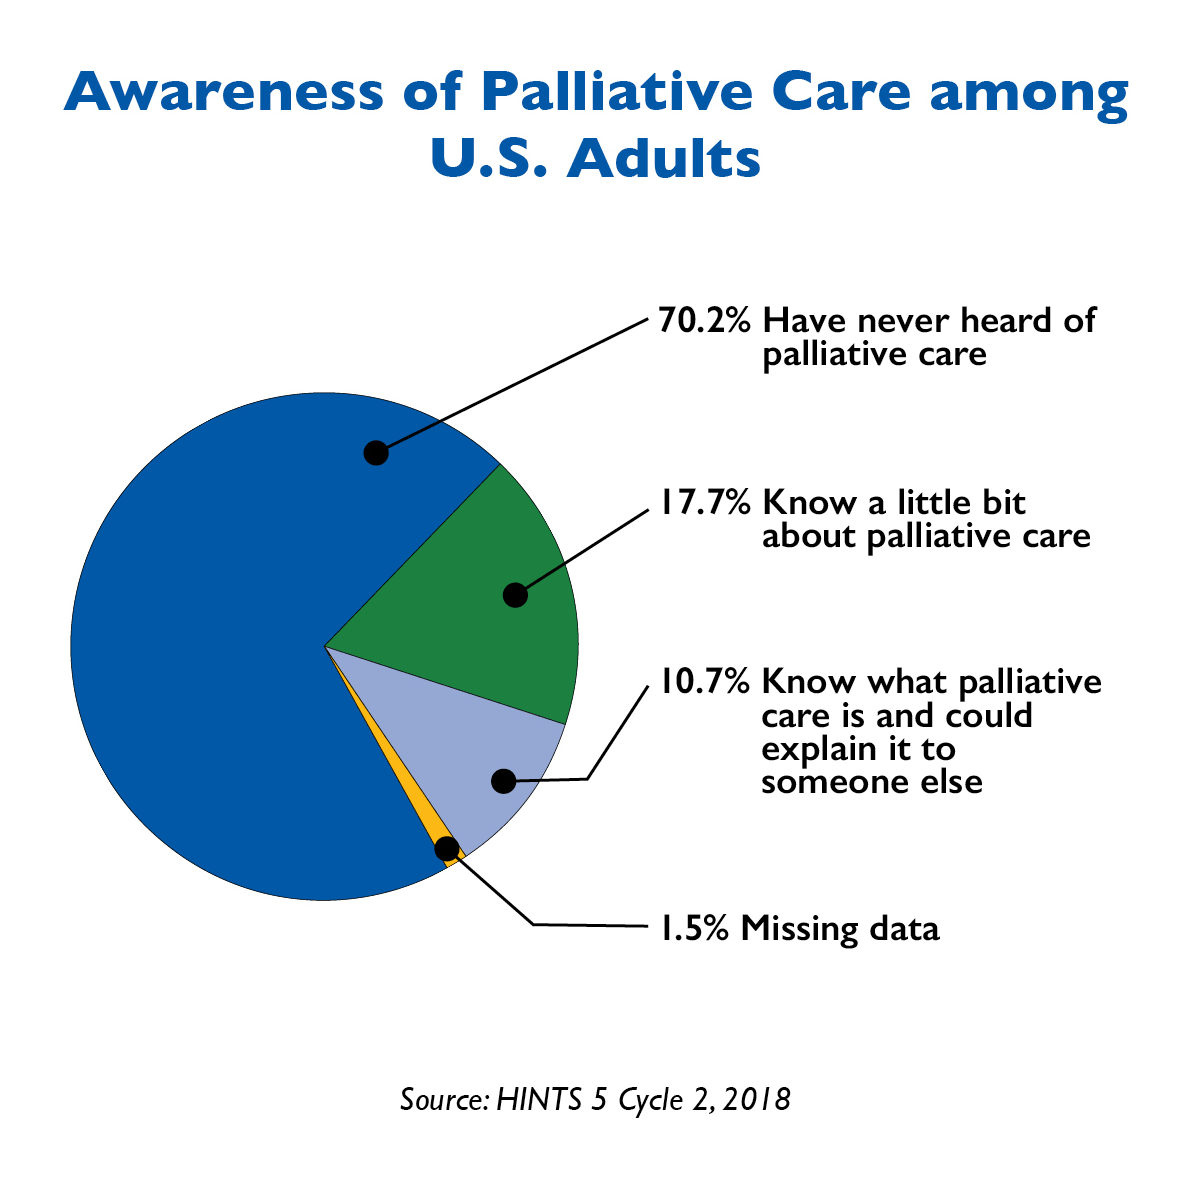
Awareness of Palliative Care among U.S. adults
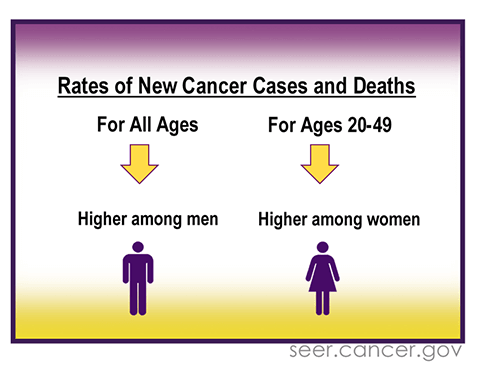
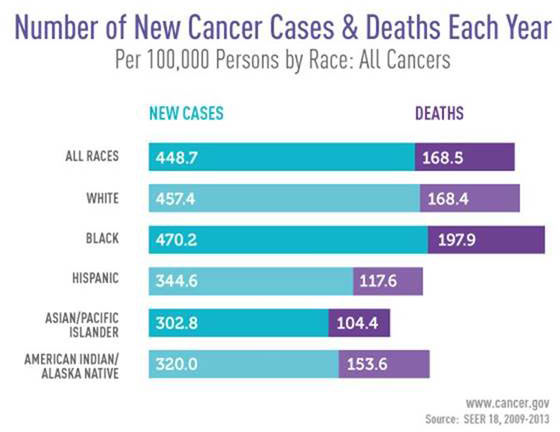
Rates of New Cancer Cases and Deaths
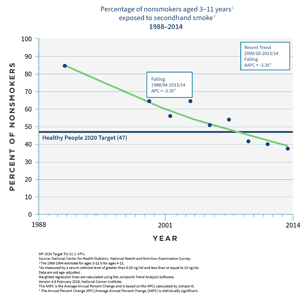
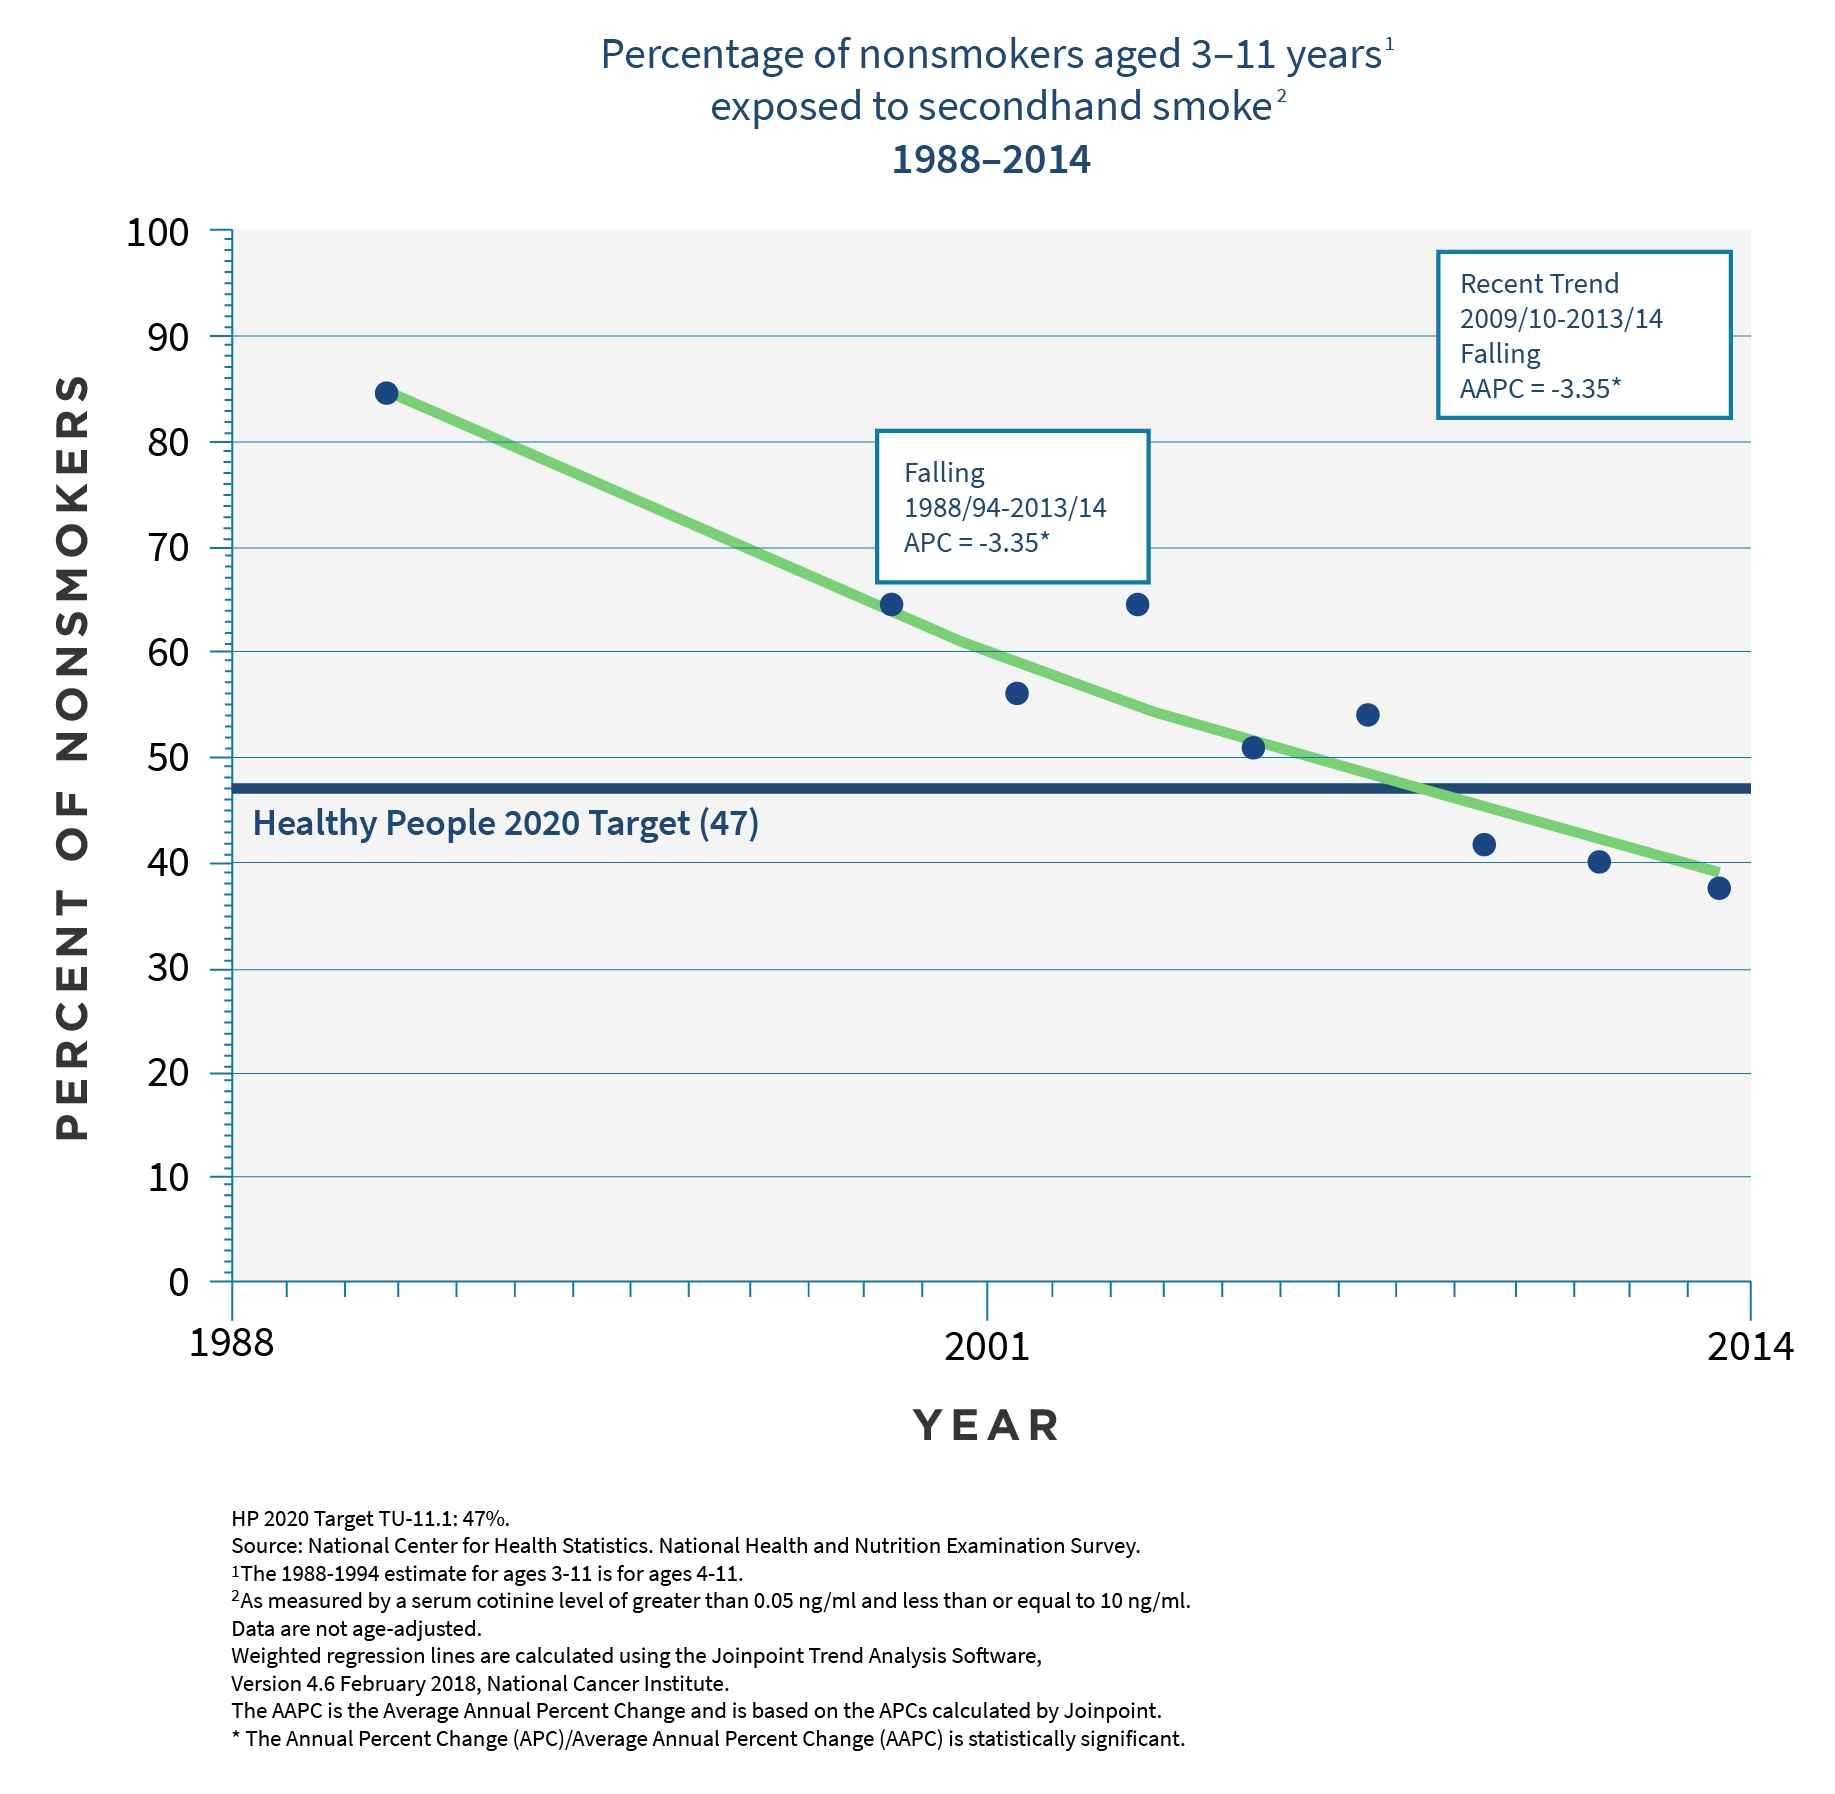
Percentage of nonsmokers aged 3 to 11 years old, exposed to secondhand smoke between 1988 and 2014
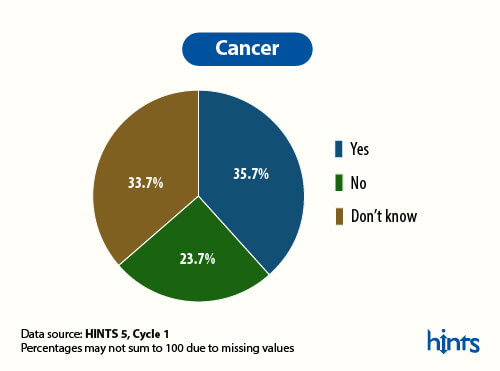
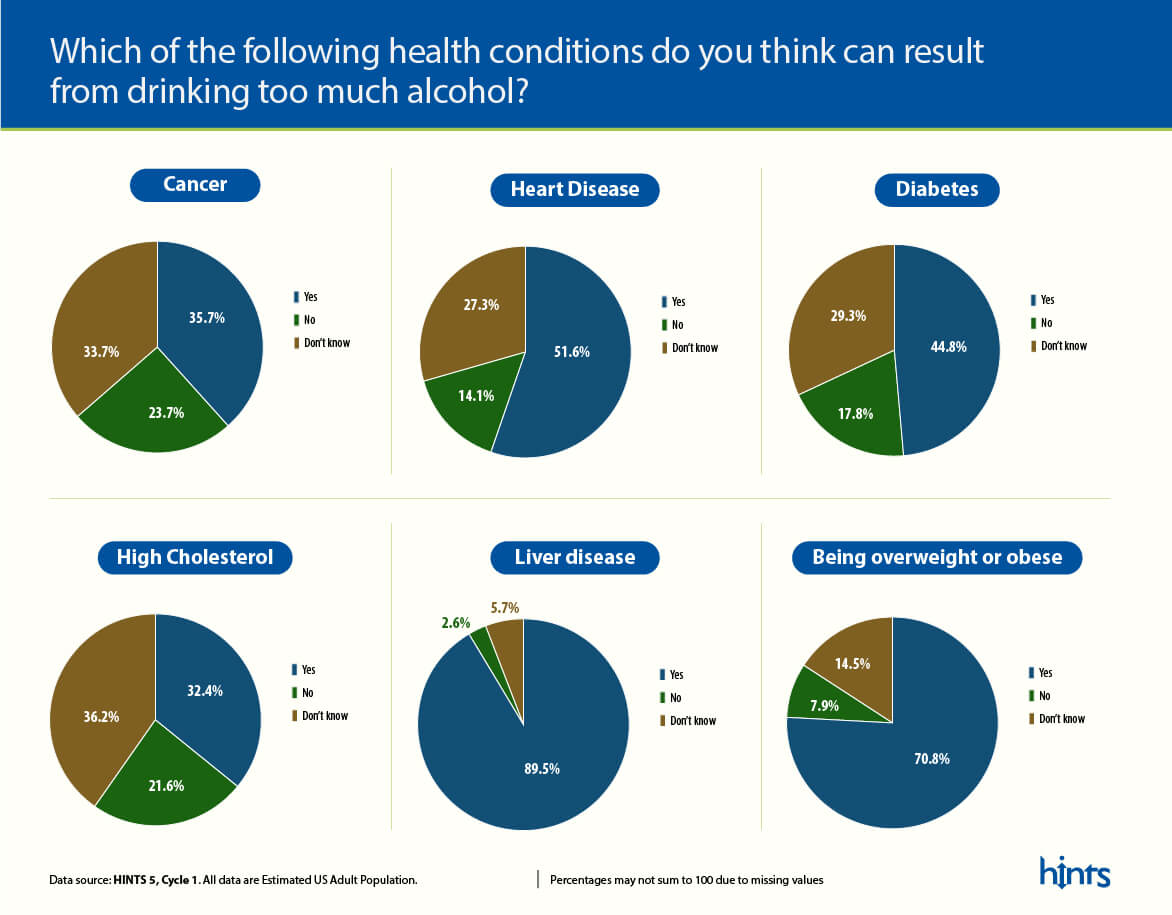
Which of the following health conditions do you think can result from drinking too much alcohol?
Tobacco Use & Lung Cancer
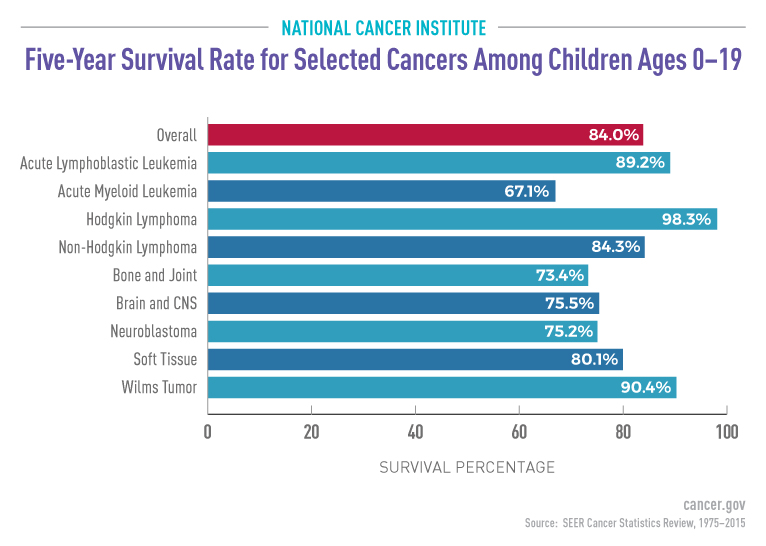
Five-Year Survival for Selected Cancers Among Children
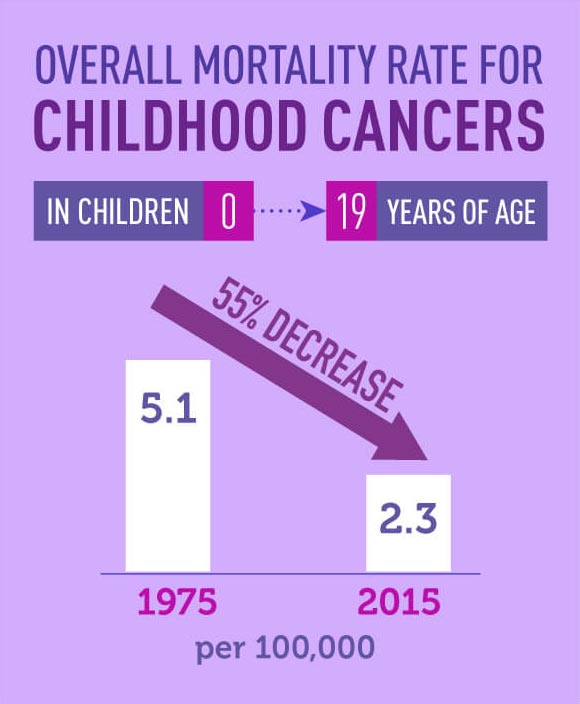
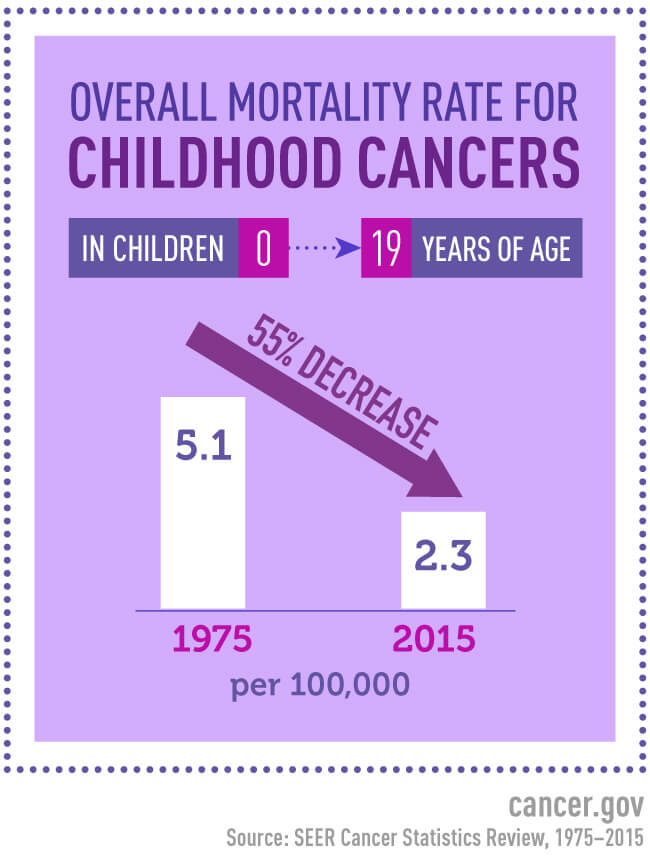
Overall Mortality Rate for Childhood Cancer
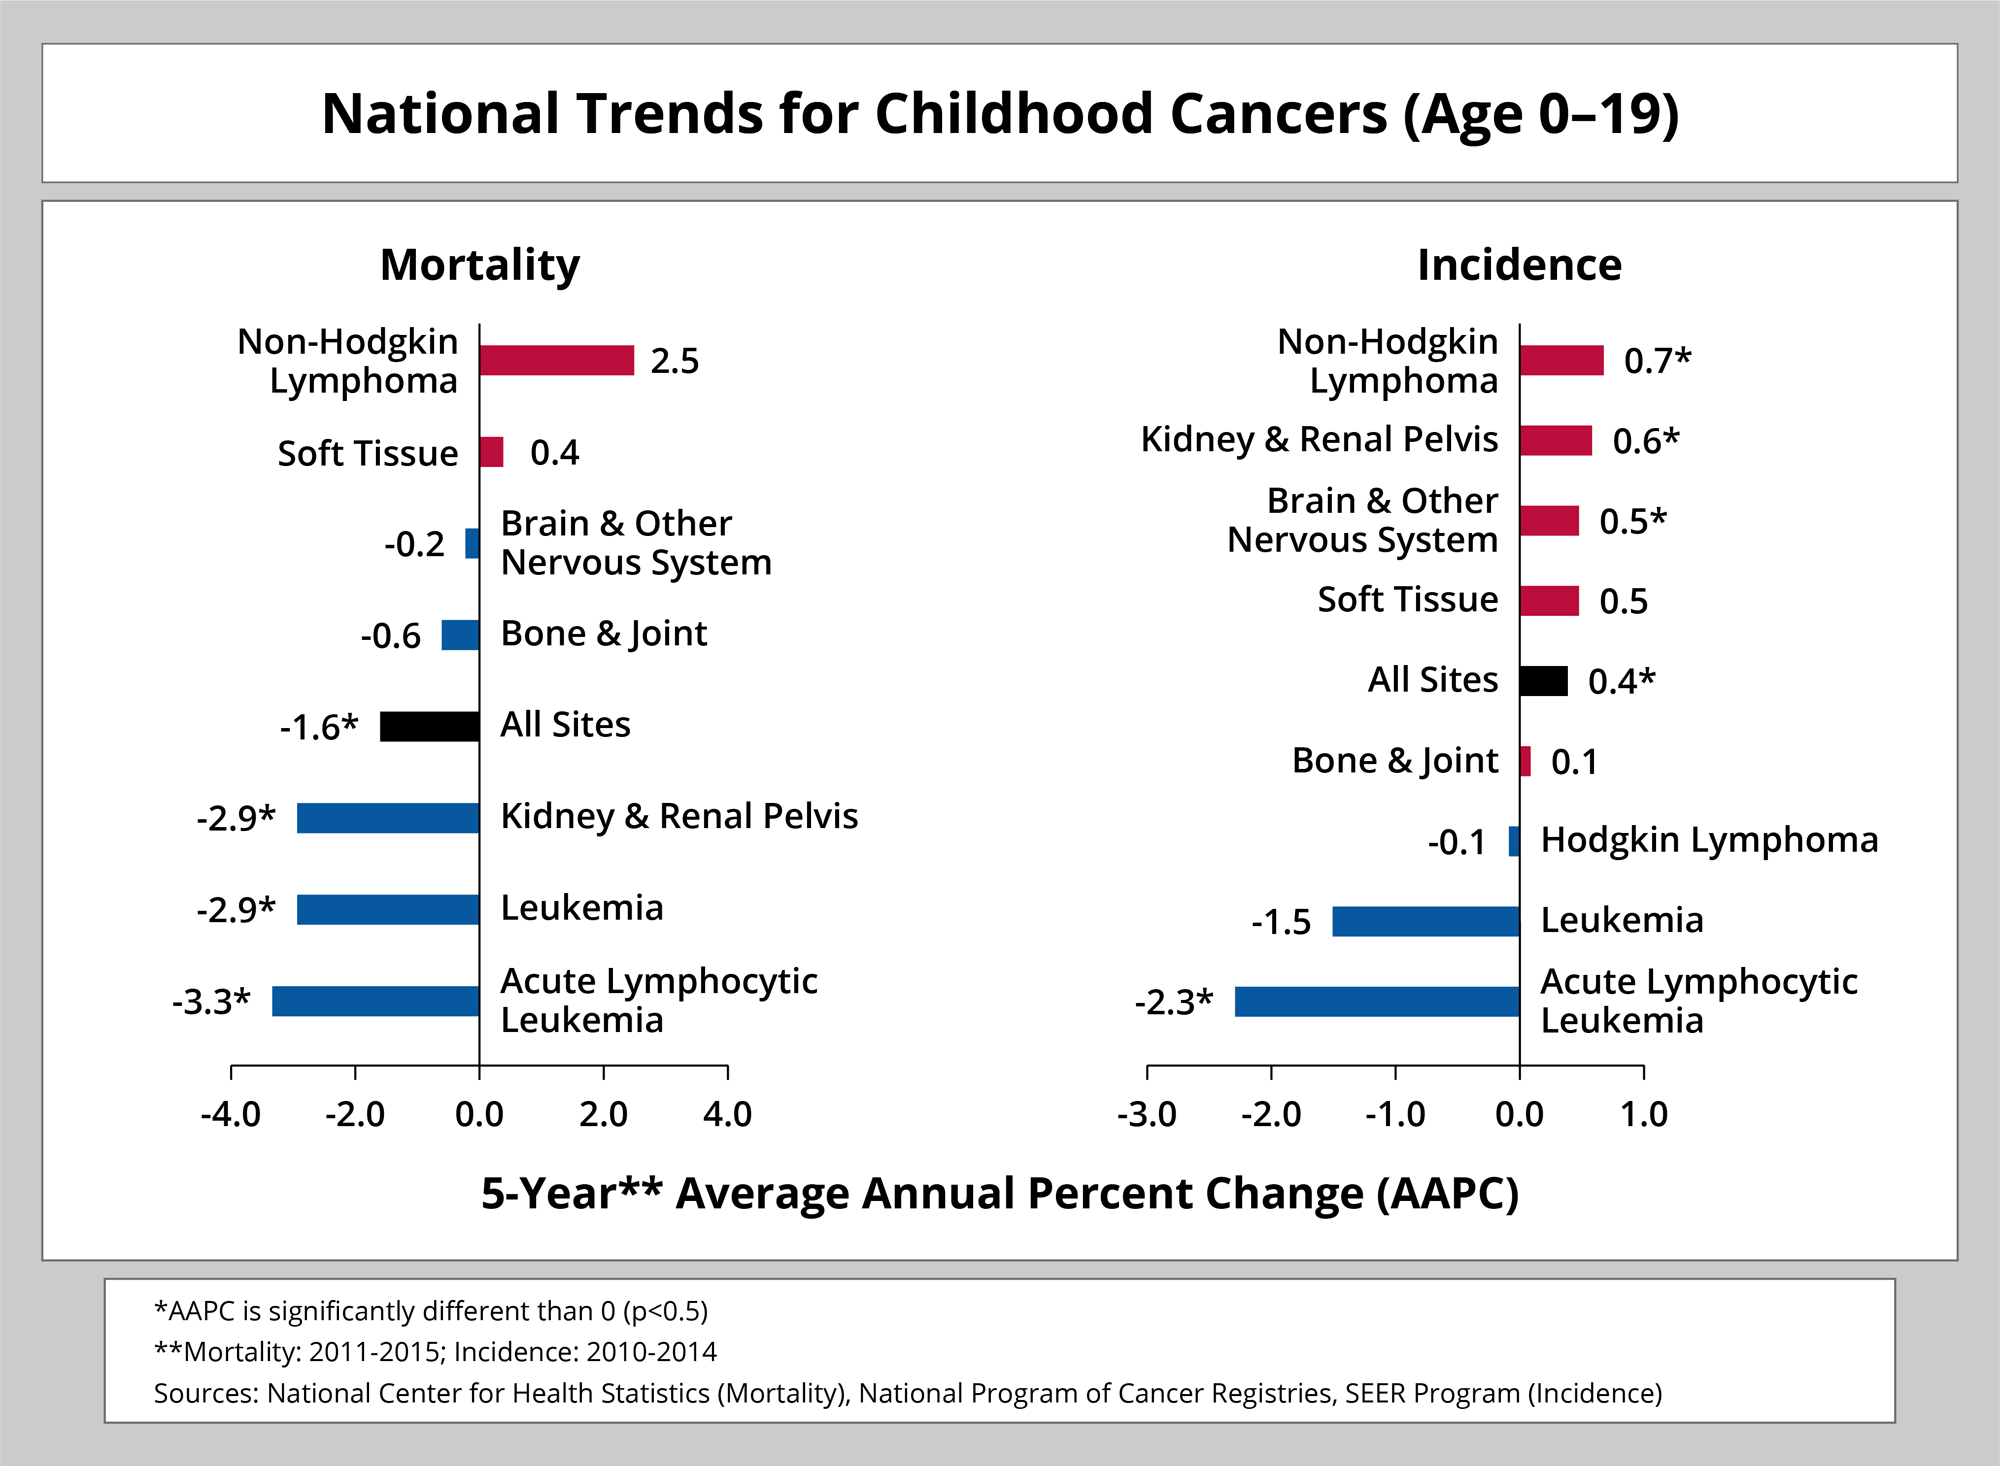
National Trends for Childhood Cancers (Age 0-19)
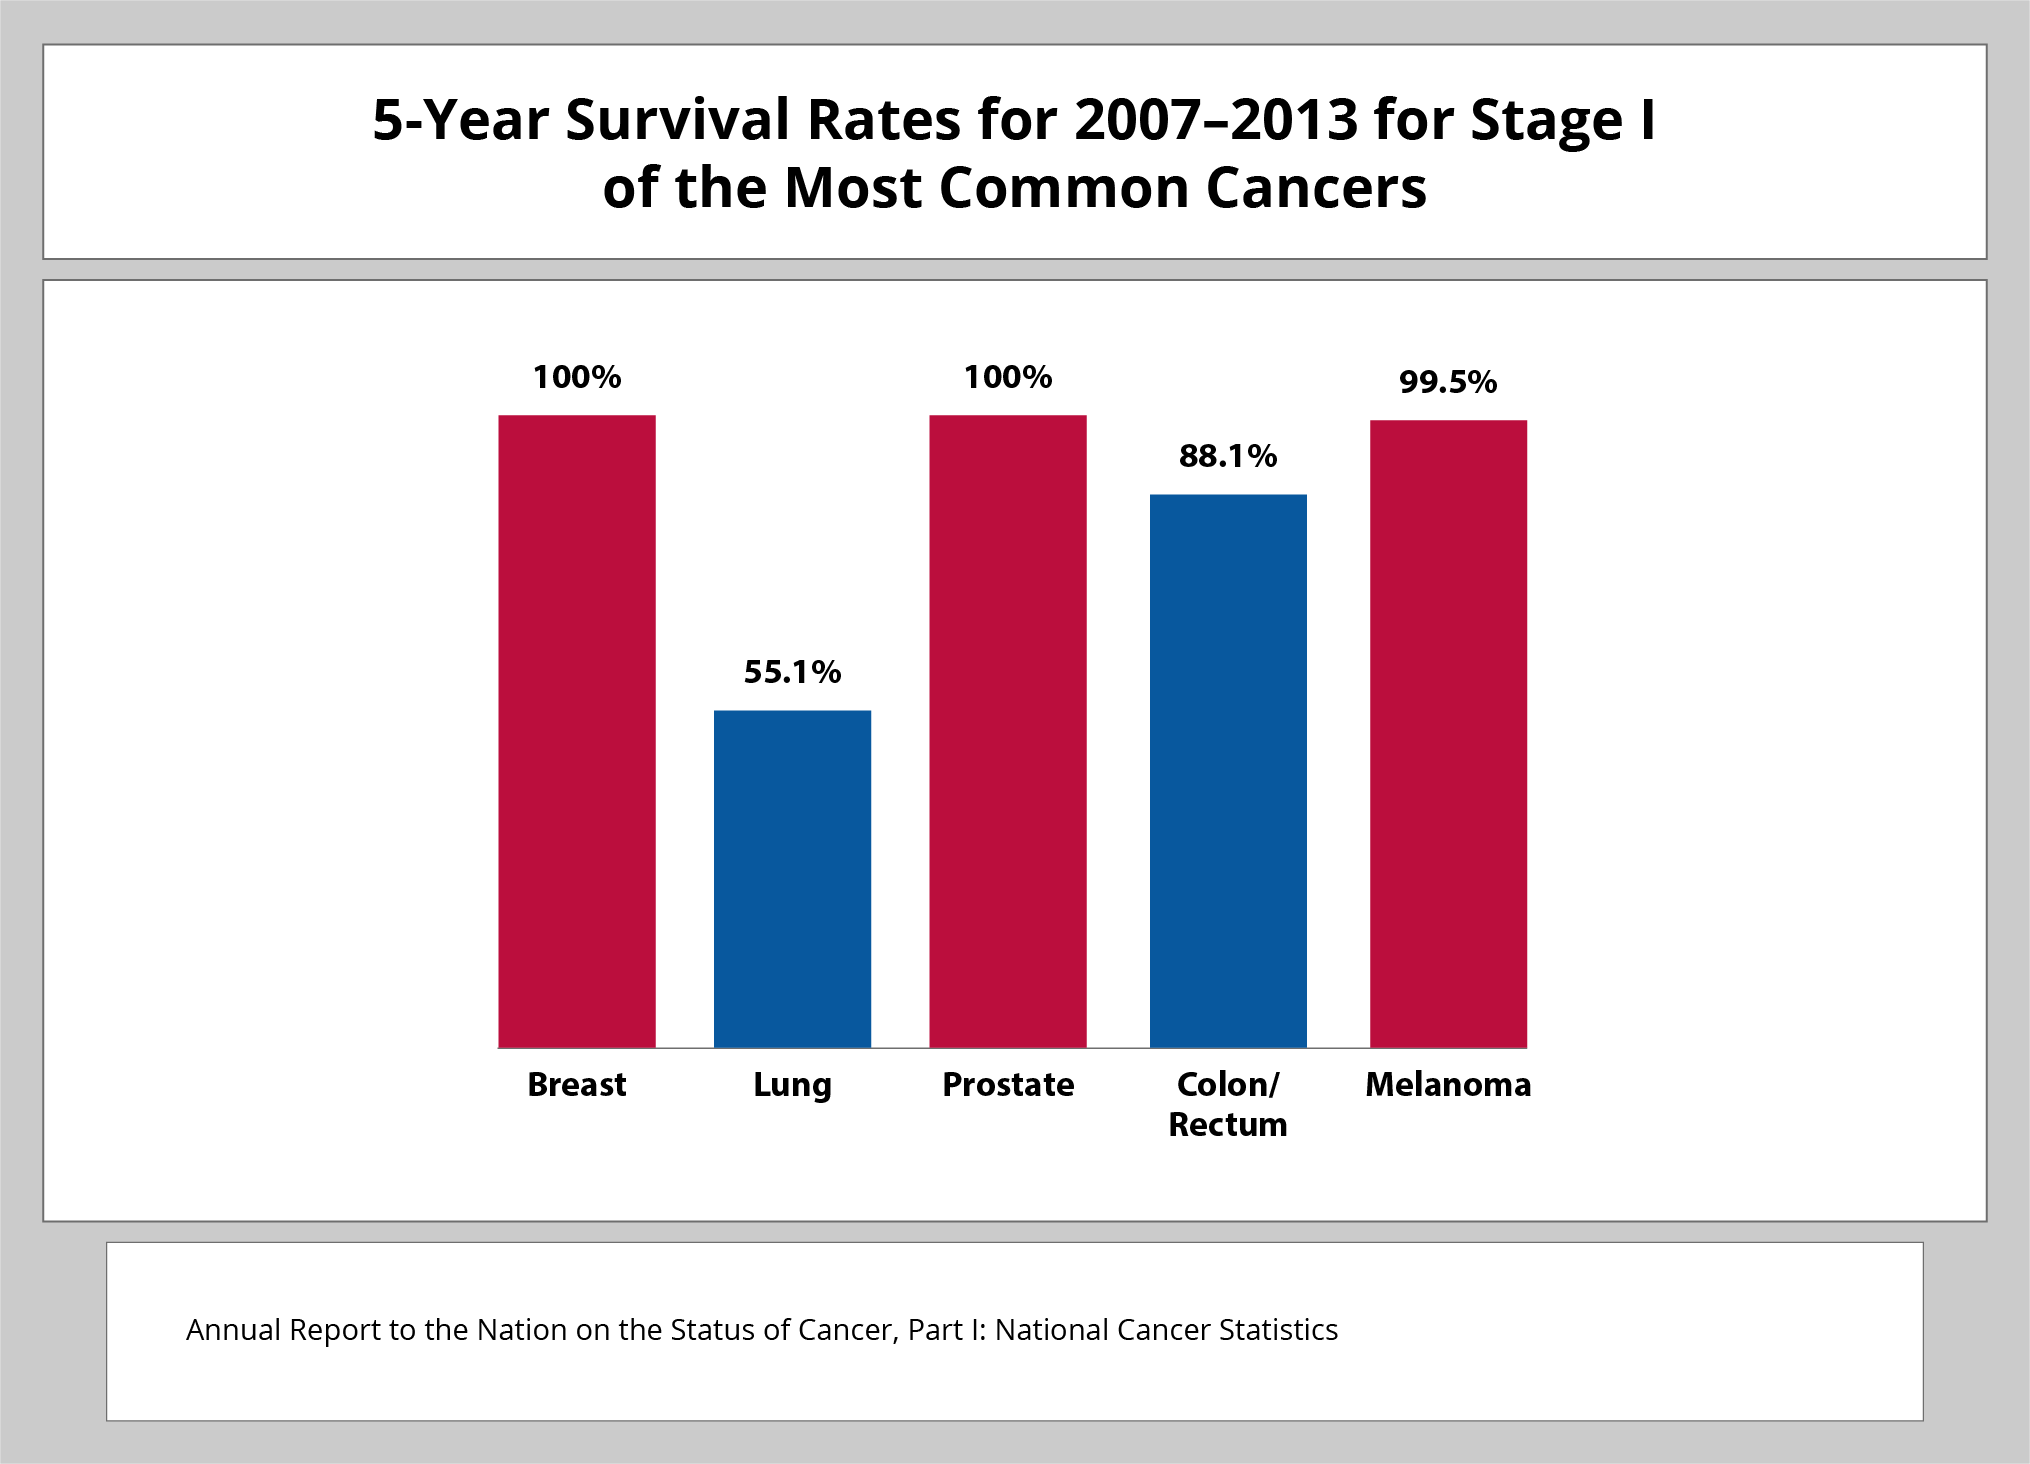
5-Year Survival Rates for 2007 – 2013 for Stage I of the Most Common Cancers
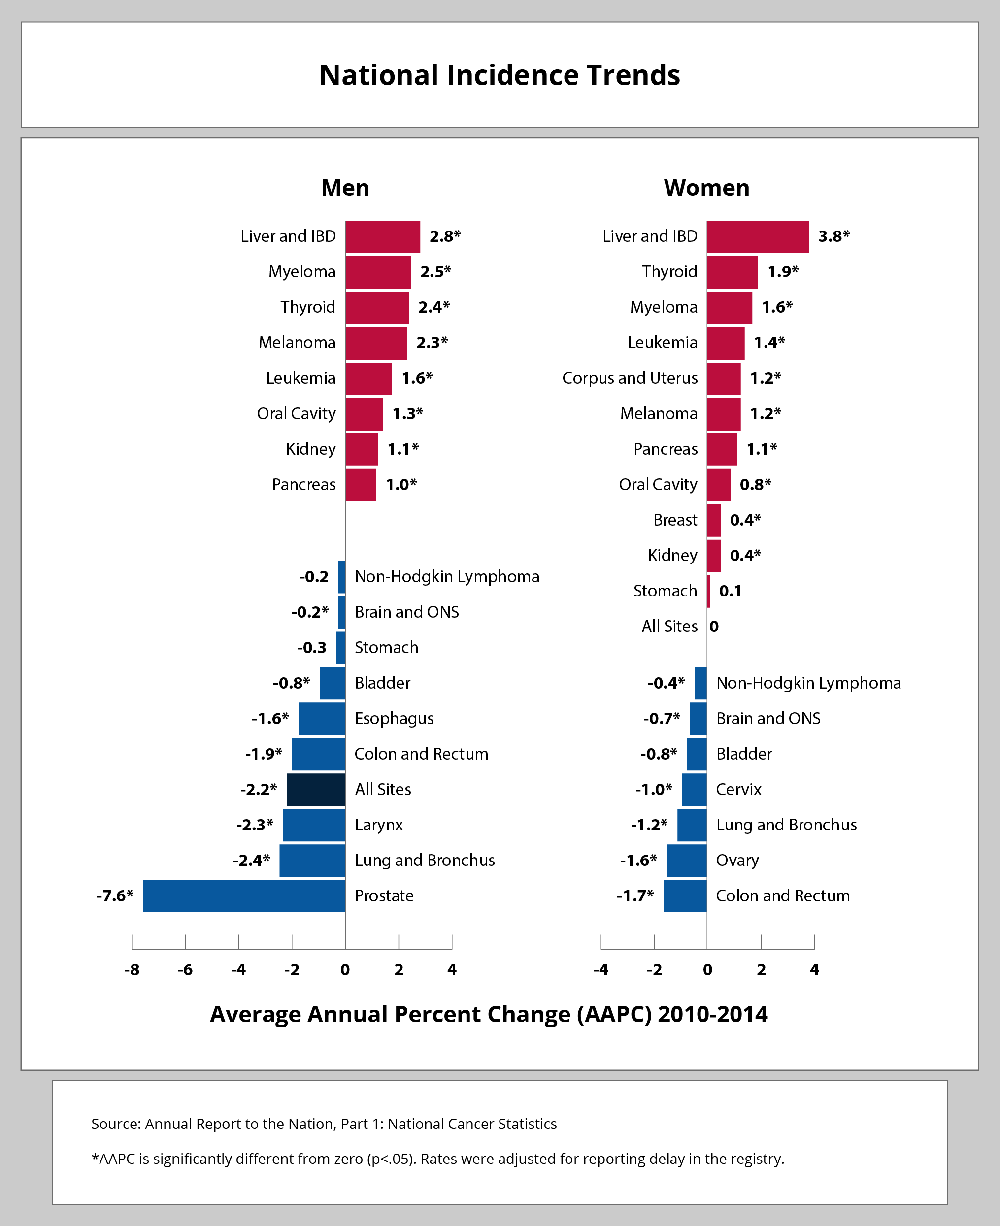
National Incidence Trends
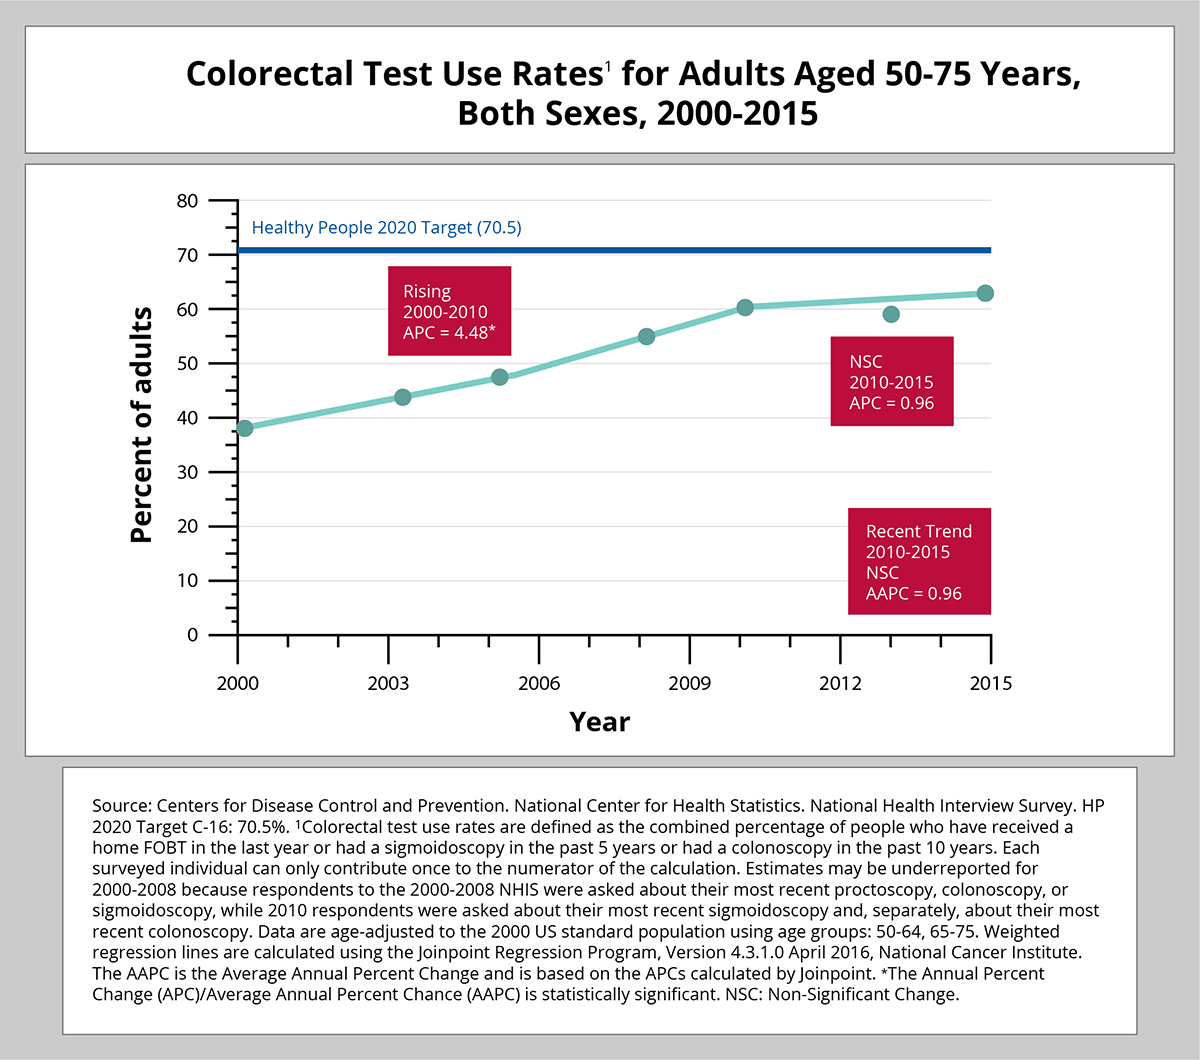
Colorectal Test Use Rates for Adults Aged 50-75 Years, Both Sexes, 2000-2015
Smoke-free Air Law Coverage By State (2017)
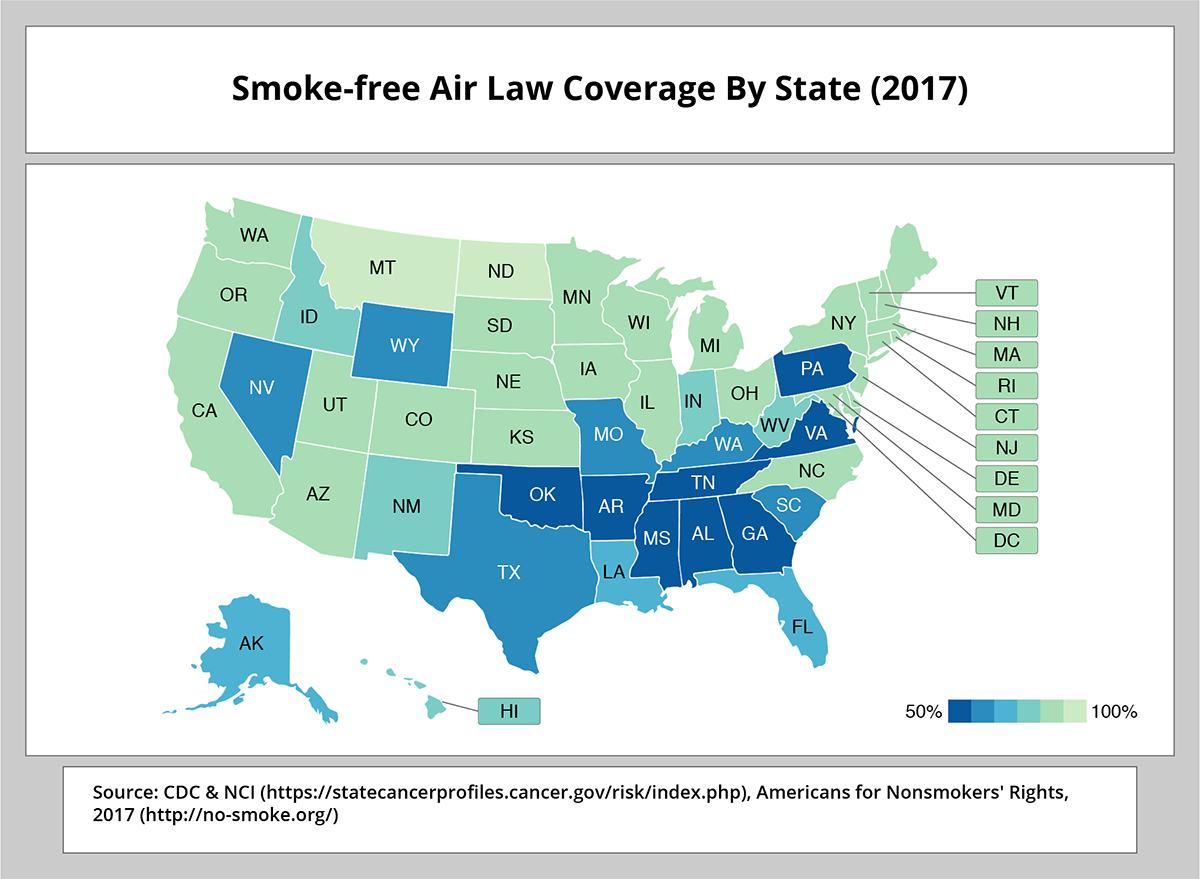
See the Tobacco Control Policy tool website for links to this and other tobacco control policy-related data: https://tobaccopolicyeffects.org/.
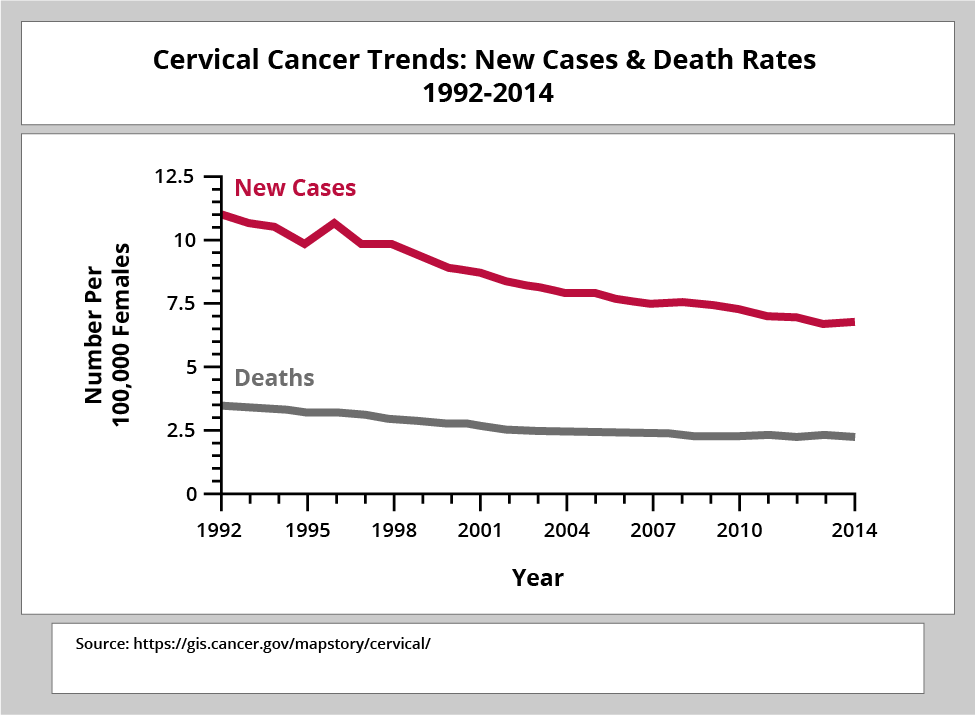
Cervical Cancer Trends: New Cases & Death Rates, 1992-2014
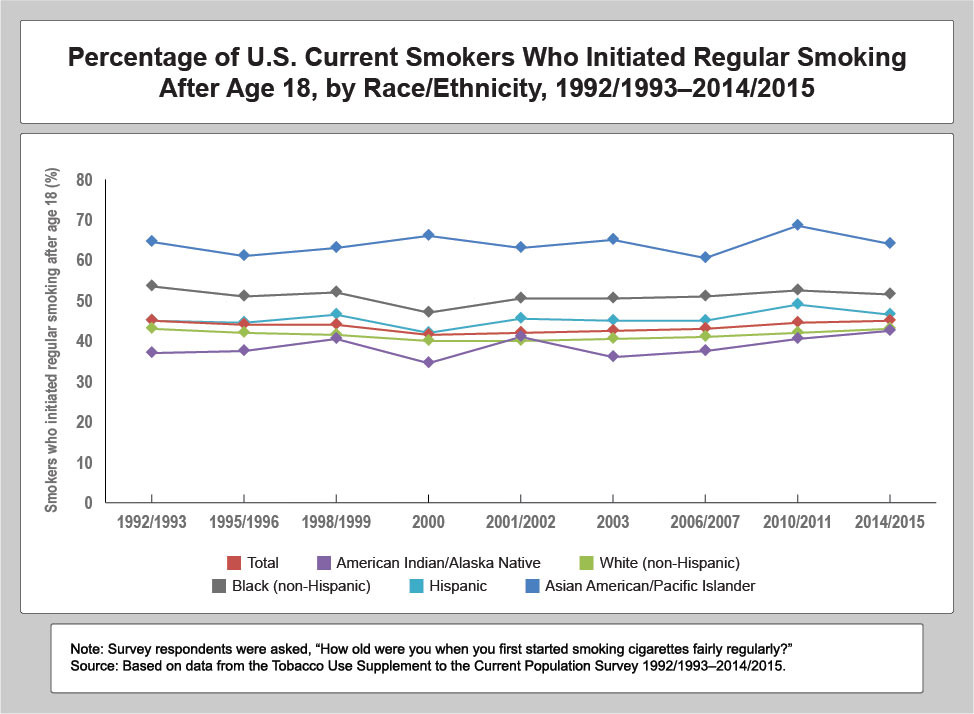
Monograph 22: A Socioecological Approach to Addressing Tobacco-Related Health Disparities
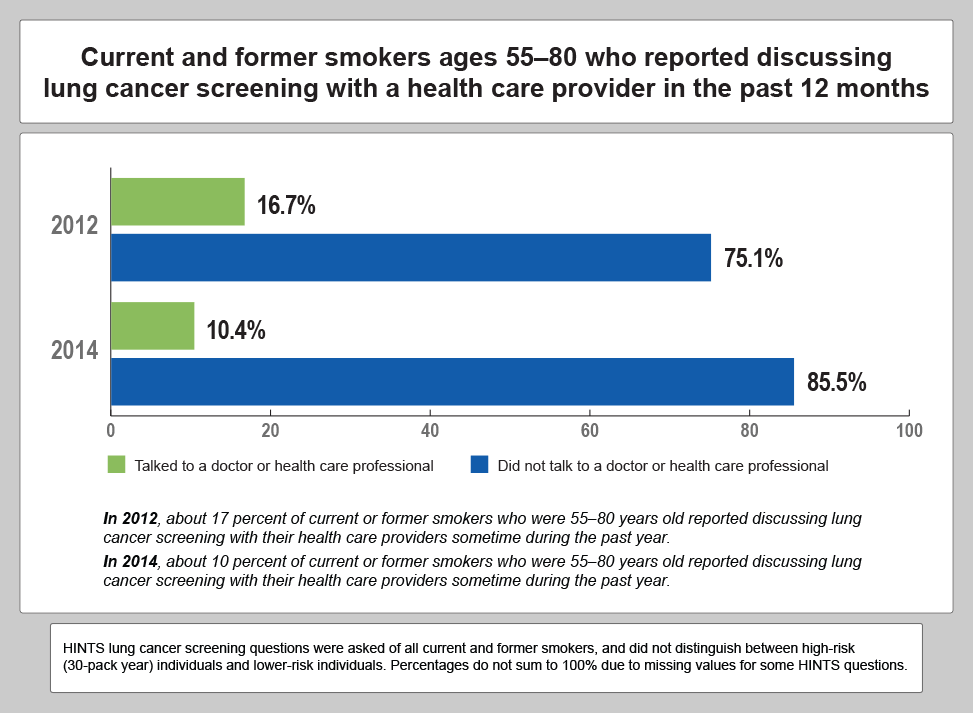
Patient-Provider Discussions About Lung Cancer Screening Remain Infrequent
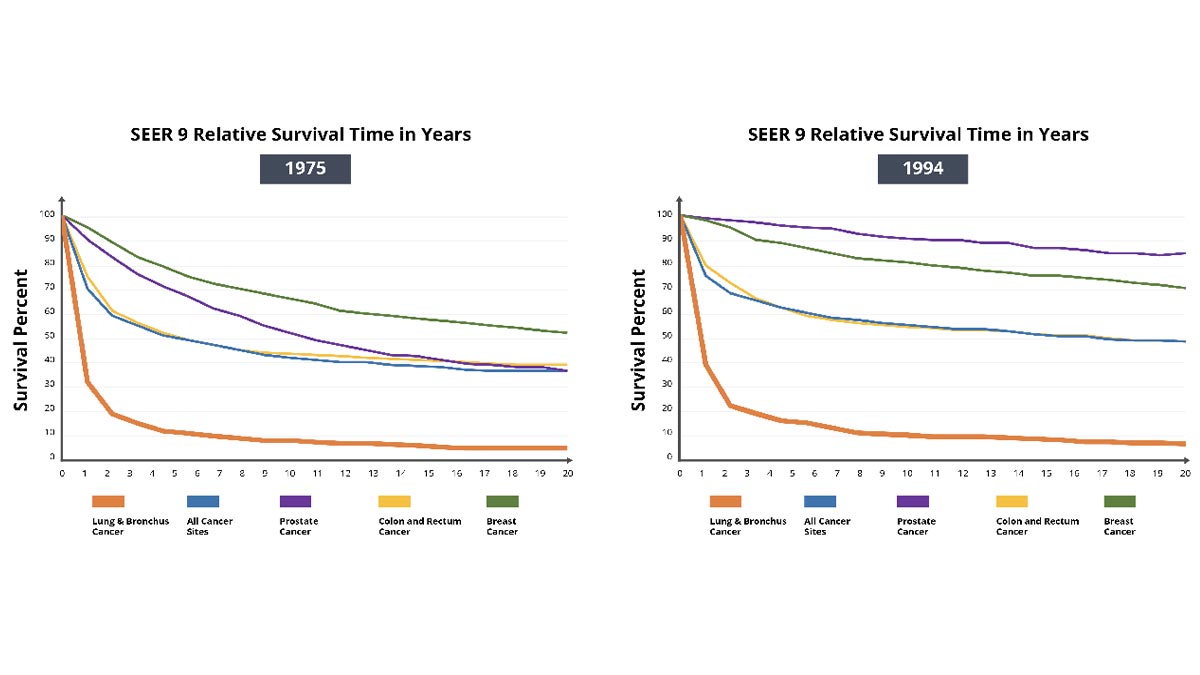
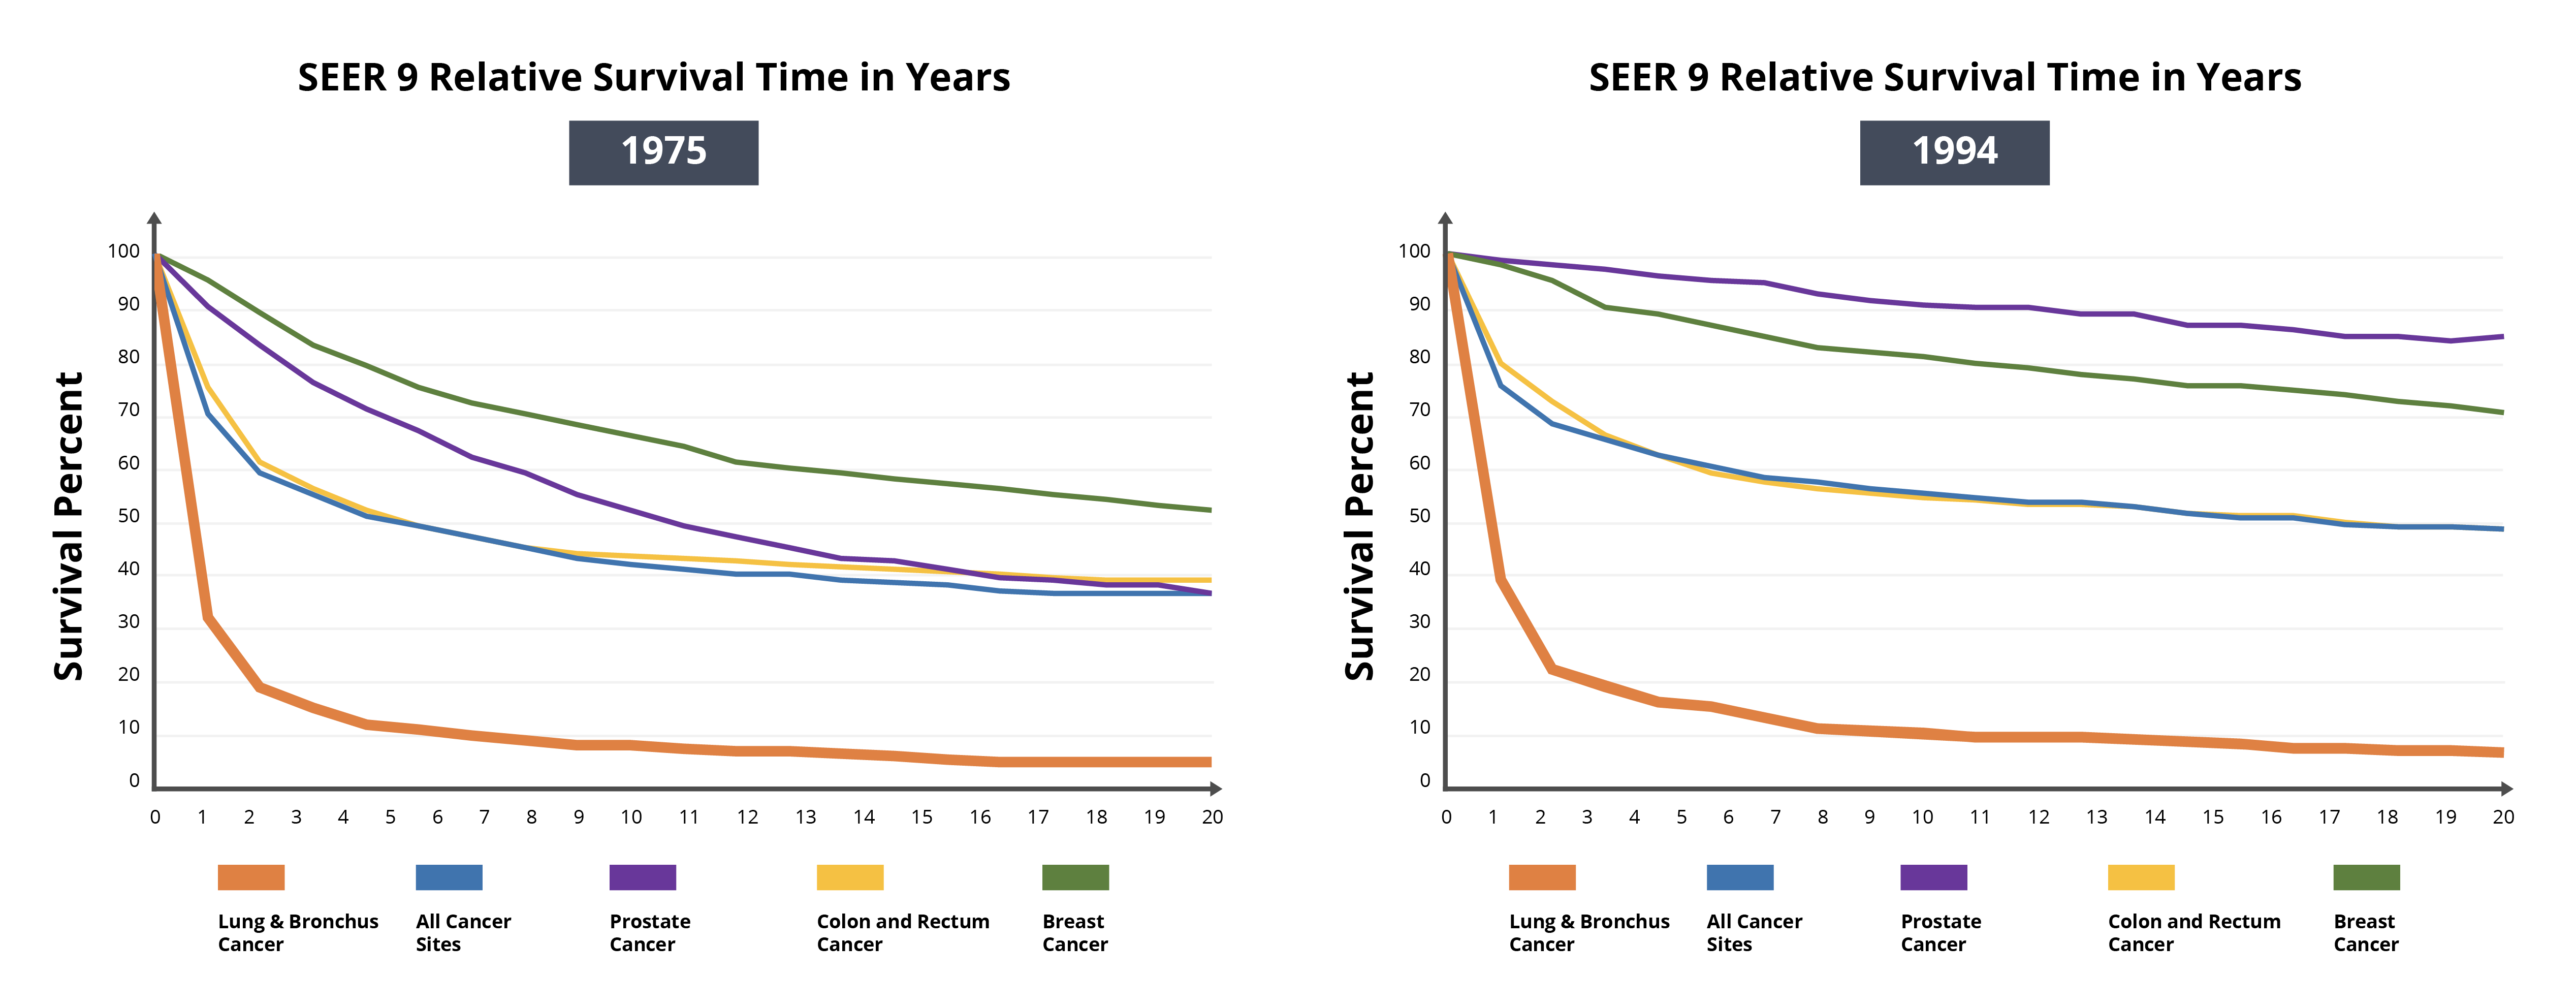
Annual Report to the Nation on the Status of Cancer, 1975-2014, Featuring Survival
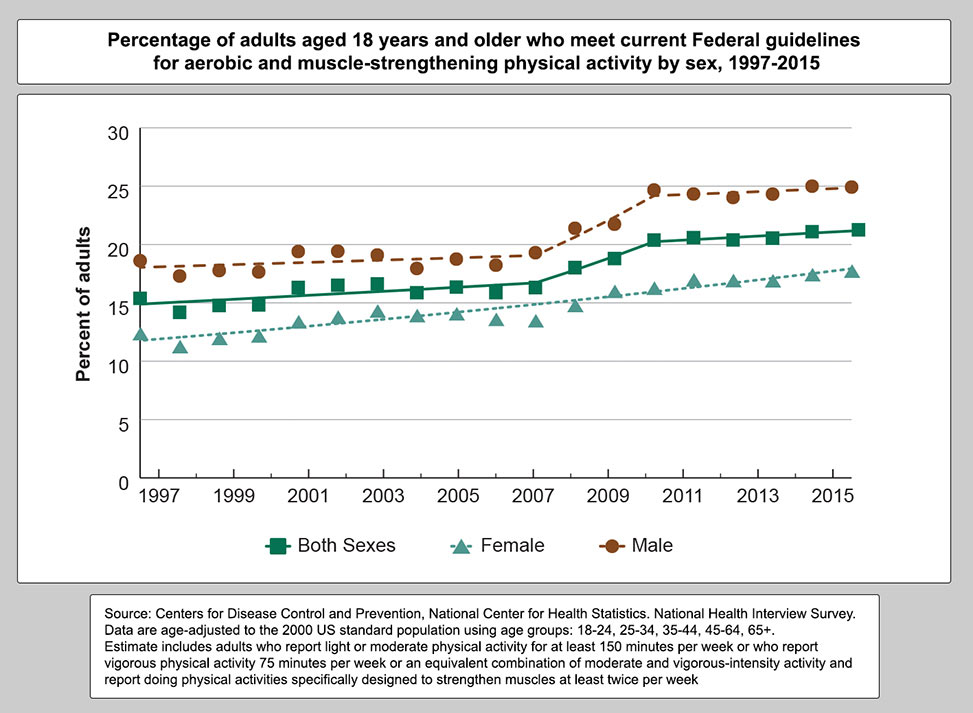
Cancer Trends Progress Report: Physical Activity Trends
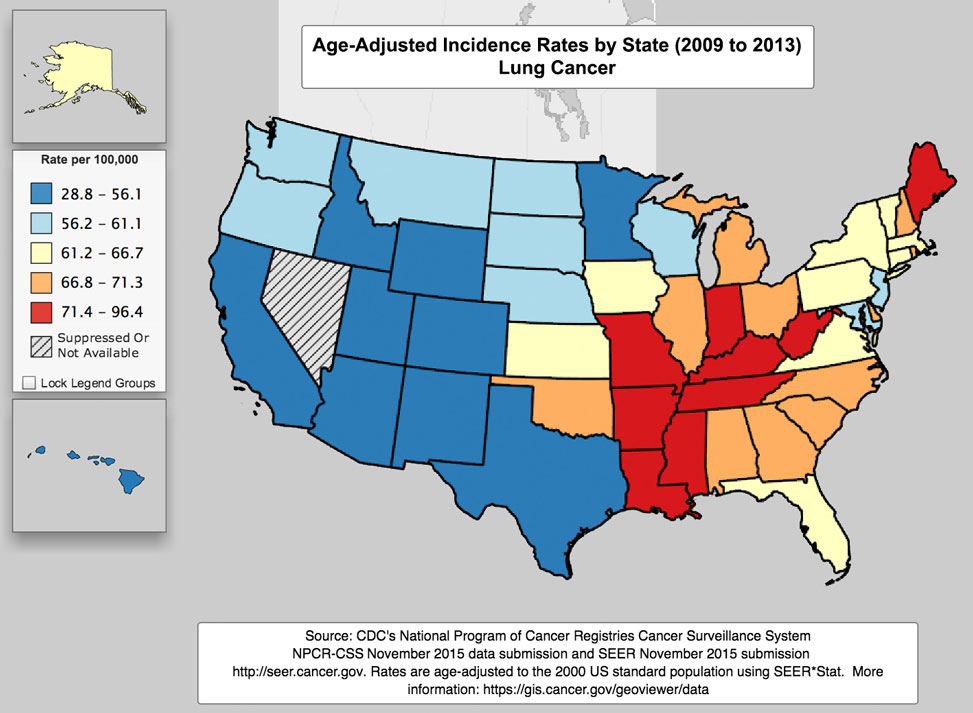
Age-Adjusted Incident Rates by State (2009 to 2013) Lung Cancer
Estimated Number of Cancer Survivors in the U.S., by Site
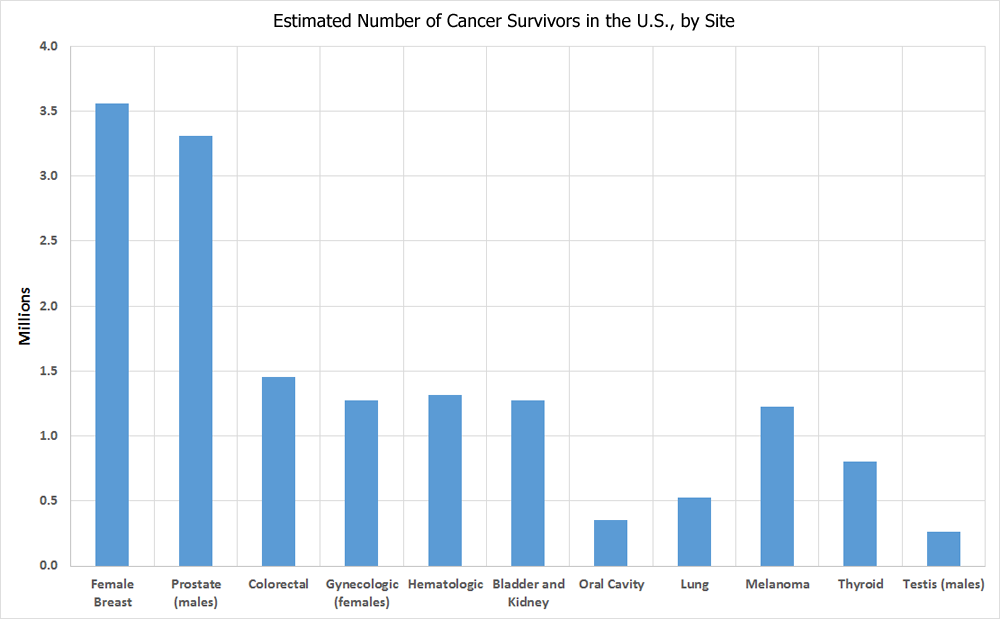
American Cancer Society. Cancer Treatment & Survivorship Facts & Figures 2016-2017. Atlanta: American Cancer Society; 2016.
Miller, K. D., Siegel, R. L., Lin, C. C., Mariotto, A. B., Kramer, J. L., Rowland, J. H., Stein, K. D., Alteri, R. and Jemal, A. (2016), Cancer treatment and survivorship statistics, 2016. CA: A Cancer Journal for Clinicians.
Female Breast Cancer Incidence
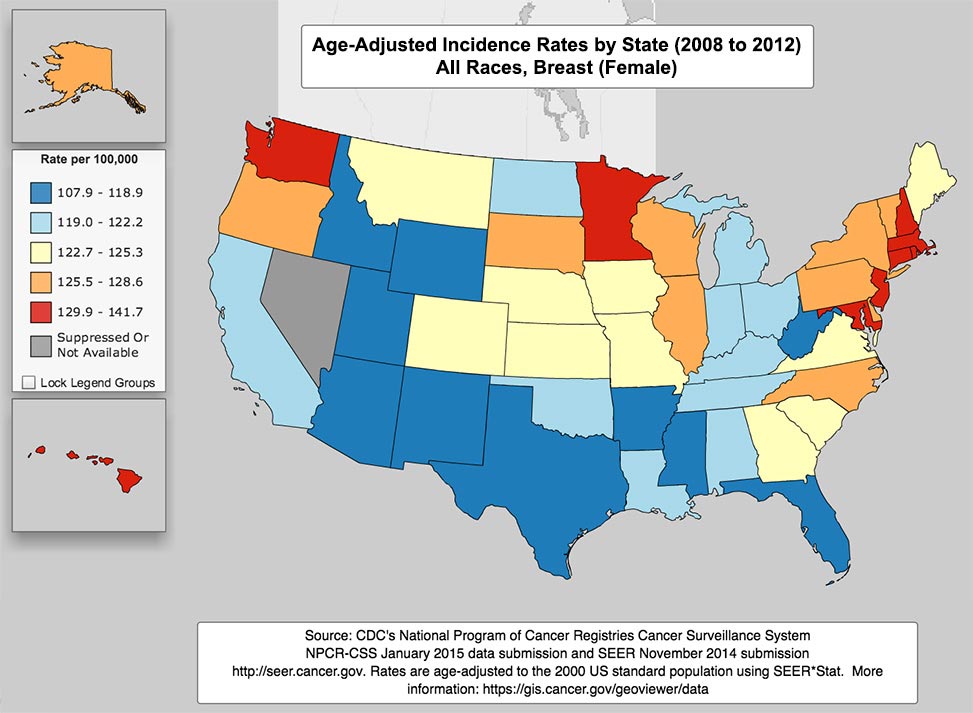
This map created with NCI GeoViewer
Number of New Cancer Cases & Deaths Each Year
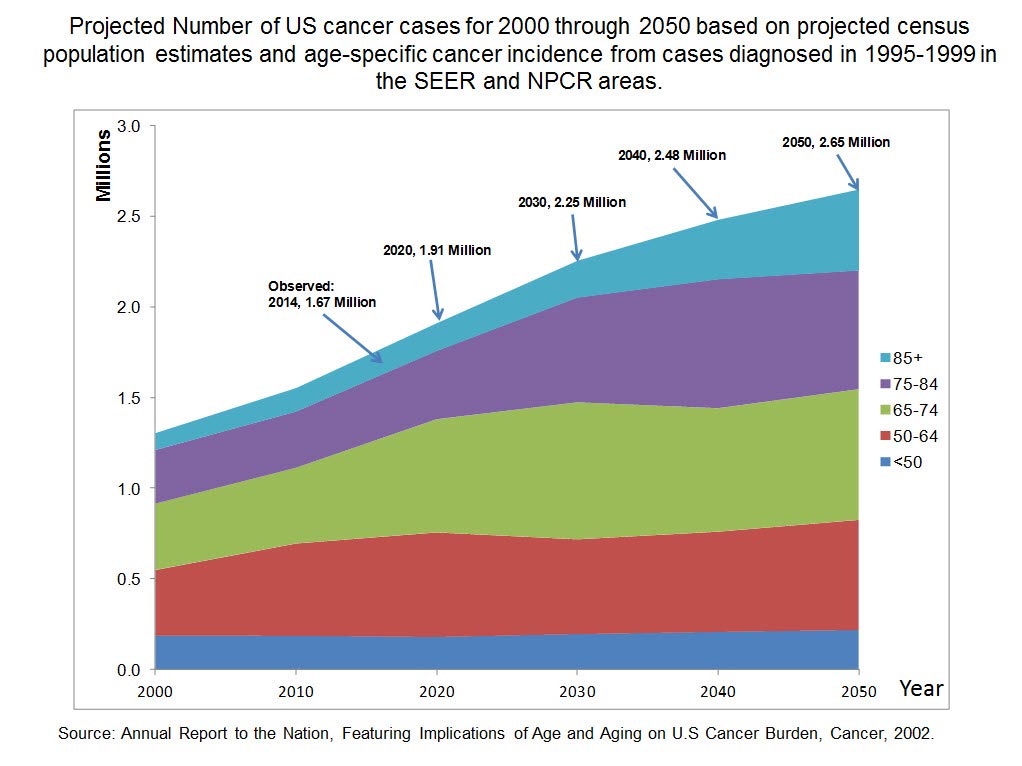
Estimated Cancer Prevalence by Age in the US Population from 1975 to 2040
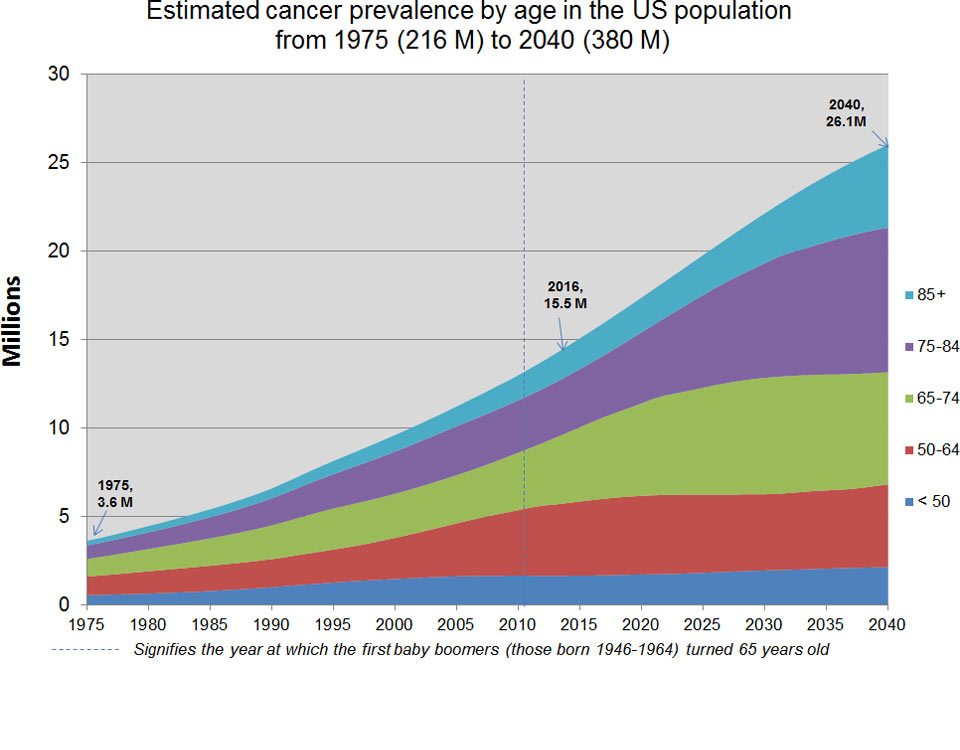
Source: Bluethmann SM, Mariotto AB, Rowland, JH. Anticipating the ''Silver Tsunami'': Prevalence Trajectories and Comorbidity Burden among Older Cancer Survivors in the United States. Cancer Epidemiol Biomarkers Prev. 2016;25:1029-1036.
SEER Cancer Statistics Review (CSR) 1975-2013
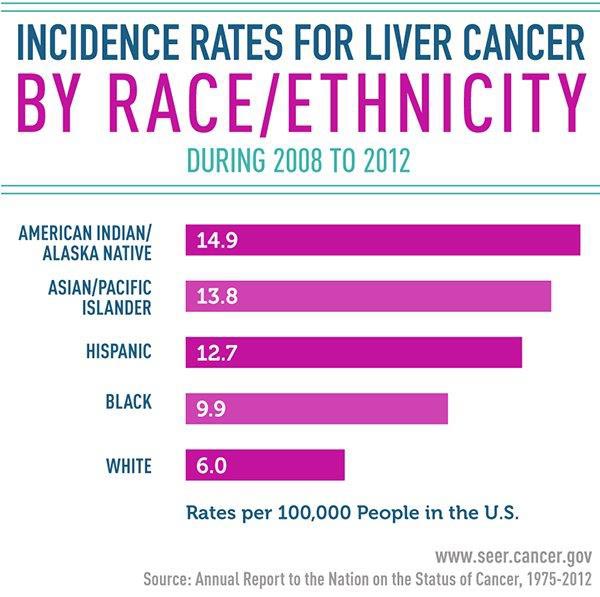
The Annual Report to the Nation on the Status of Cancer: Incidence Rates for Liver Cancer by Race/Ethnicity During 2008-2012
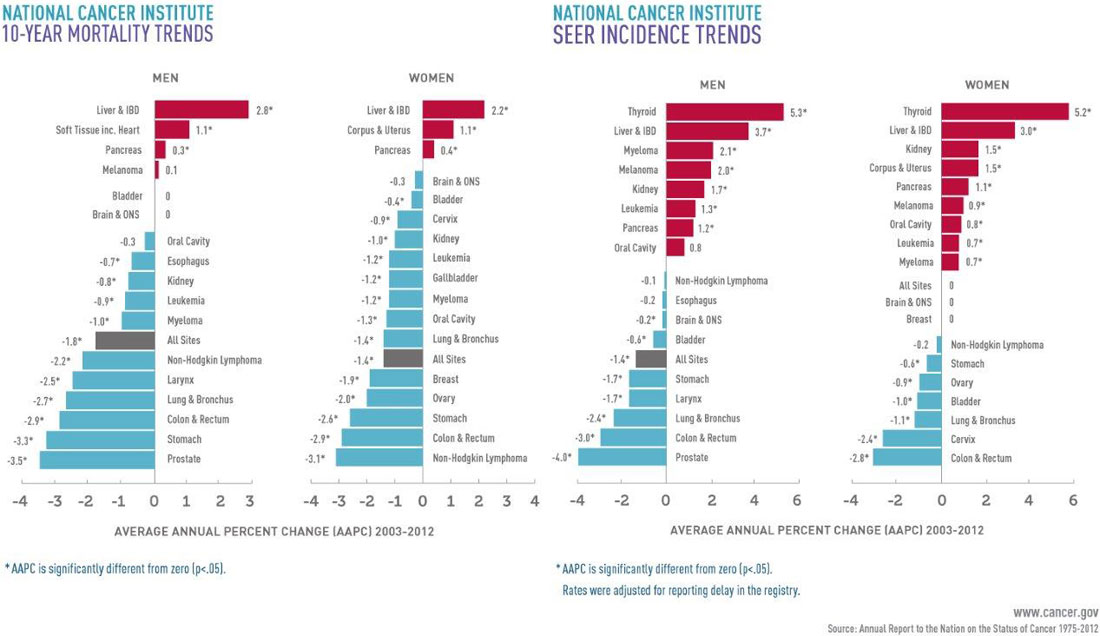
The Annual Report to the Nation on the Status of Cancer: Long-term mortality trends, based on AAPC, 2003-2012
Monitoring a Changing Health Information Environment
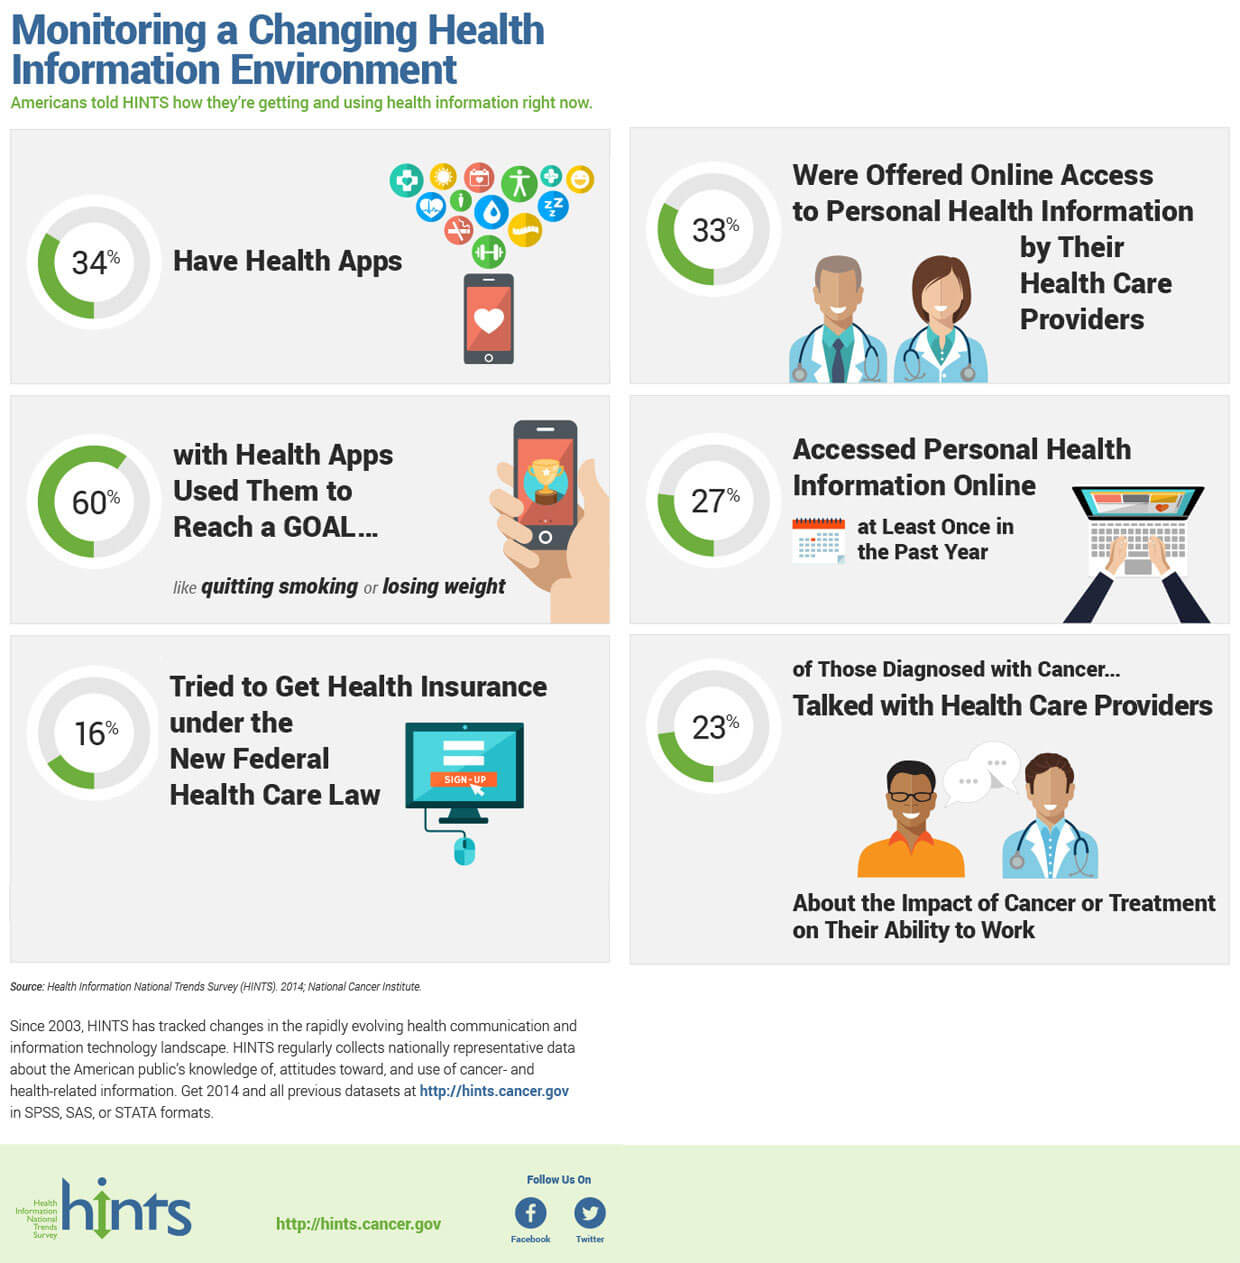
Monitoring a Changing Health Information Environment: American told HINTS how they’re getting and using health information right now
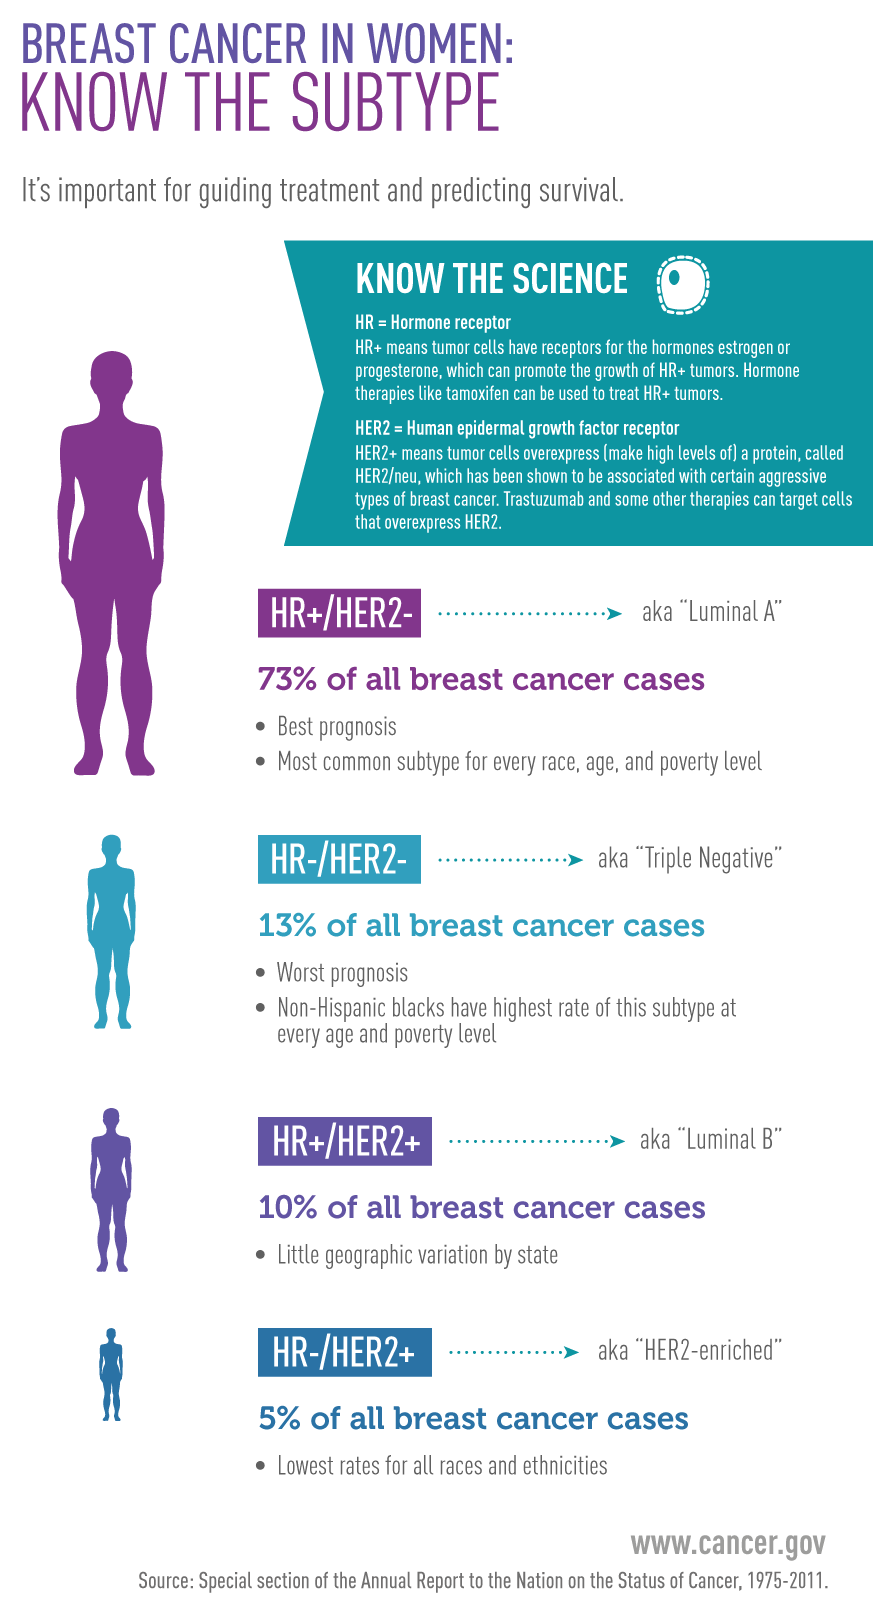
Up for a Challenge? Stimulating Innovation in Breast Cancer Genetic Epidemiology
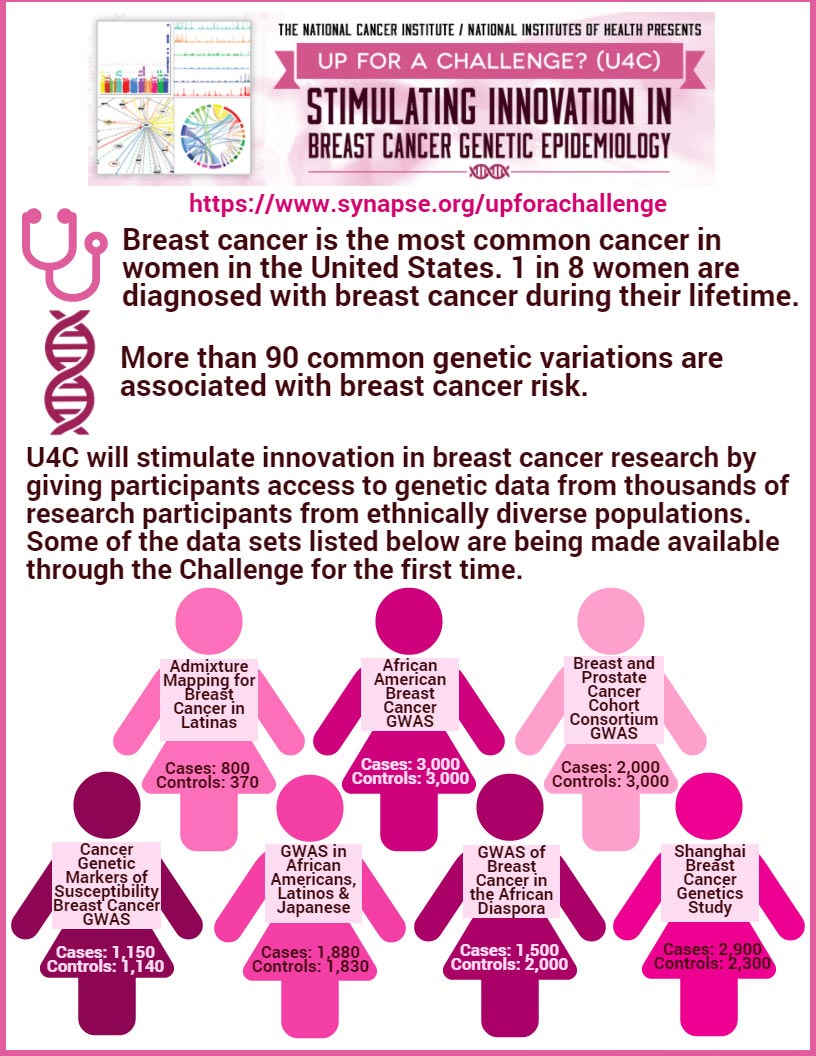
Up for a Challenge? Stimulating Innovation in Breast Cancer Genetic Epidemiology
From NCI’s Annual Plan & Budget Proposal for Fiscal Year 2017
Source: SEER 18, 2008-2012
March 2015. Colorectal Cancer Incidence Rates 2007-2011
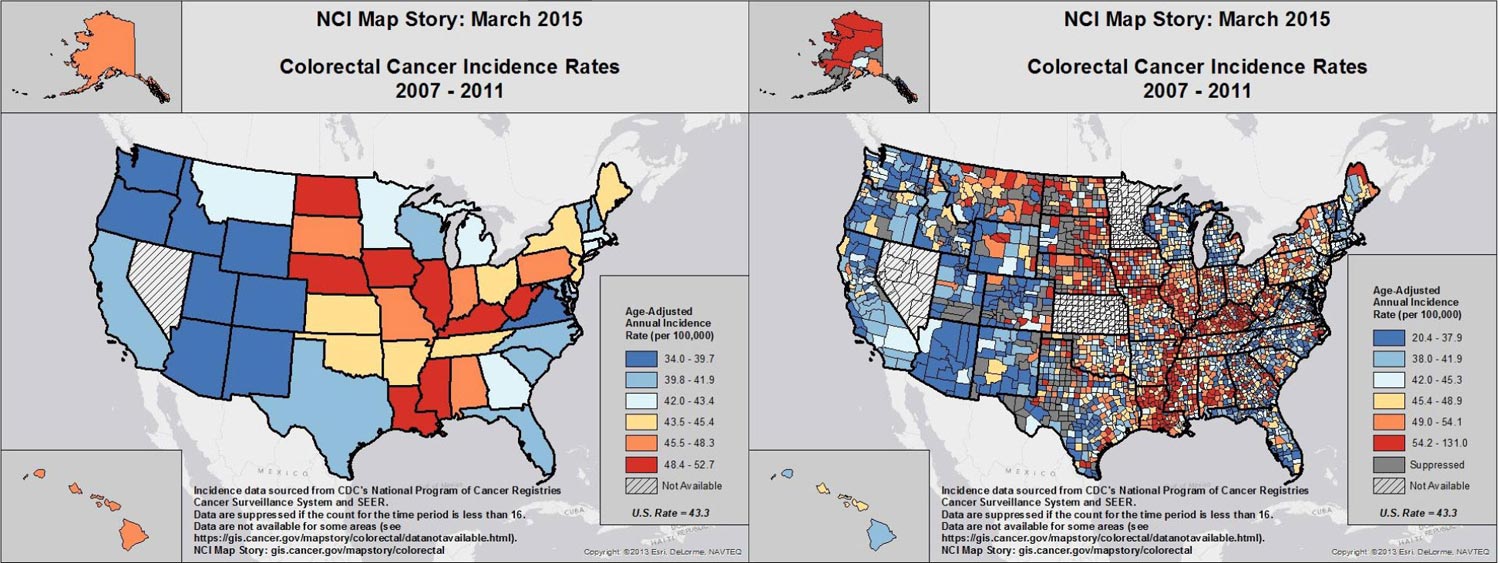
Source: Map Story: Colorectal Cancer
March 2015. Colorectal Cancer Screening Rates 2012
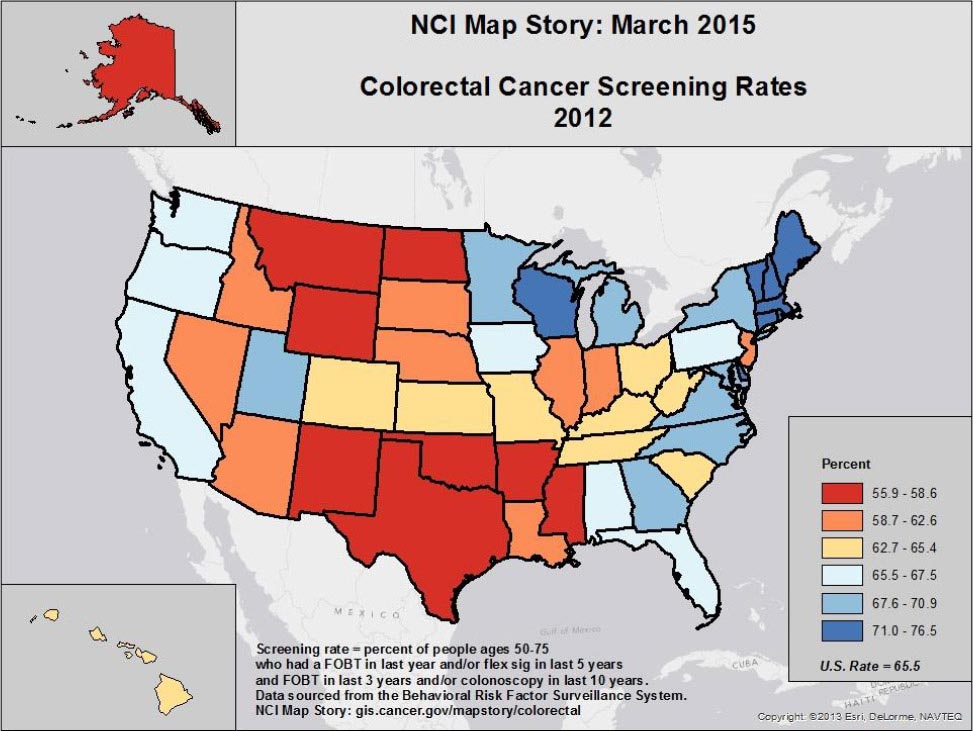
Source: Map Story: Colorectal Cancer
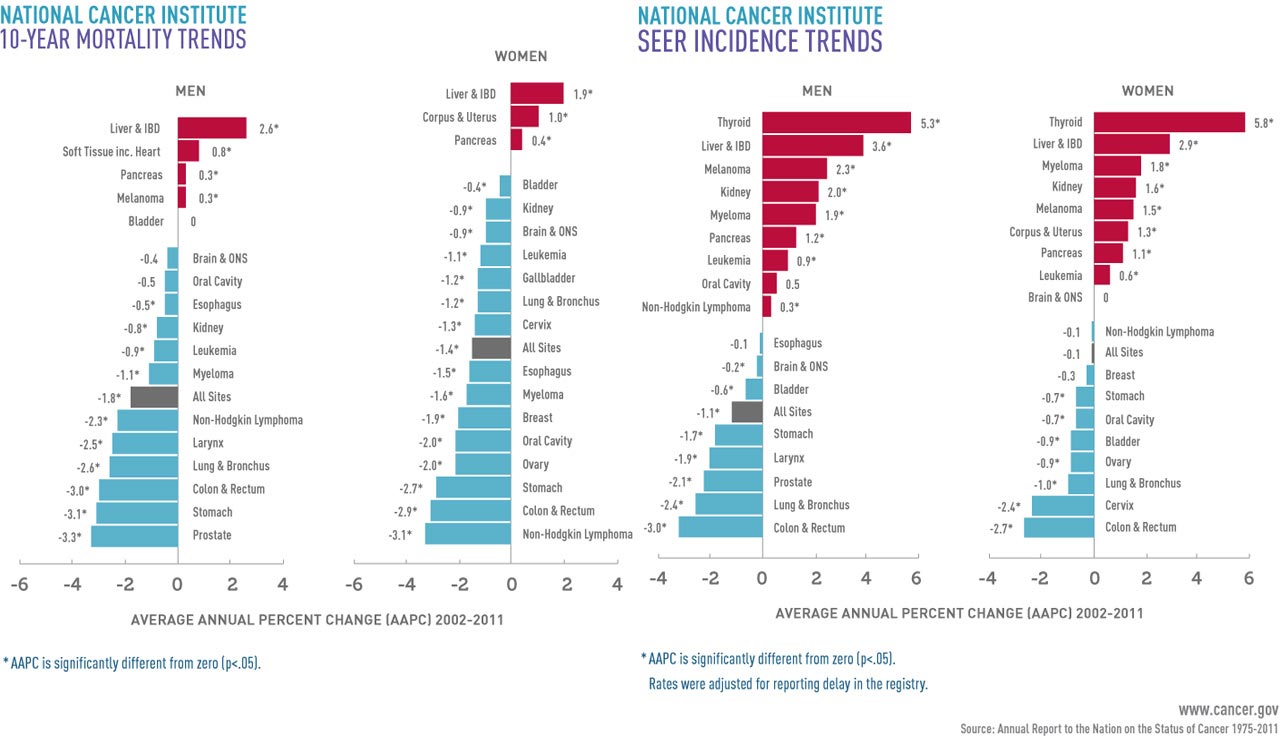
Annual Report to the Nation on the Status of Cancer, 1975-2011
The Annual Report to the Nation on the Status of Cancer: Long-term mortality trends, based on AAPC, 2001-2011
March 19, 2015: Percent of females aged 9-26 years who had received at least one dose of the HPV immunization by age, 2008-2010
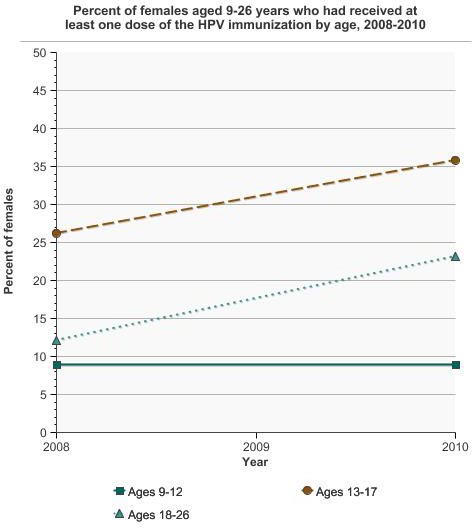
Source: Cancer Trends Progress Report. Data are not age-adjusted.
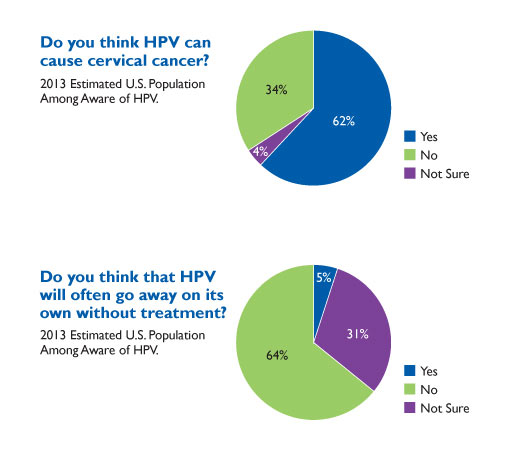
December 9, 2014: Preventing Cancer through Increased Human Papillomavirus (HPV) Vaccine Uptake
September 18, 2014: Cancer Prevalence and Cost of Care Projections
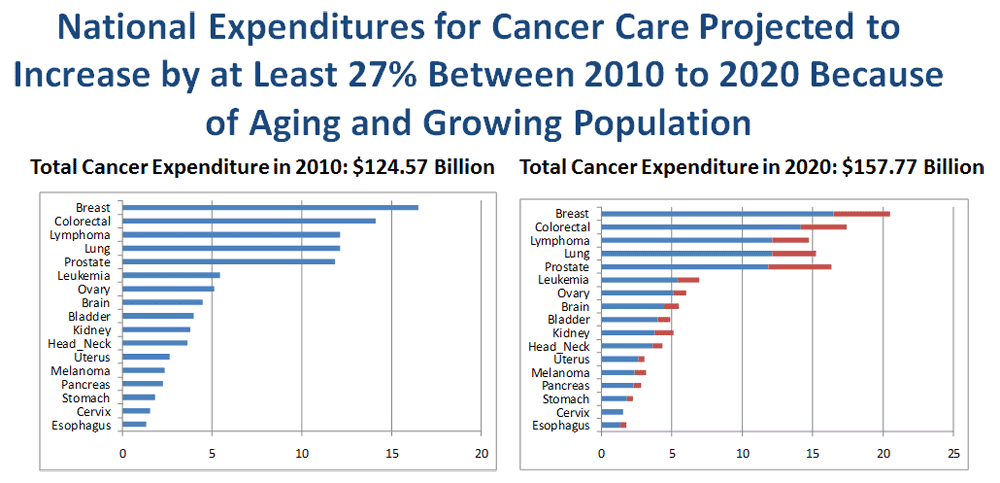
Estimates in 2010 dollars. September 18, 2014: Cancer Prevalence and Cost of Care Projections
Source: Mariotto AB, Yabroff KR, Shao Y, Feuer EJ, Brown ML. Projections of the costs of cancer care in the United States: 2010-2020. J Natl Cancer Inst 2011;103:117-128.
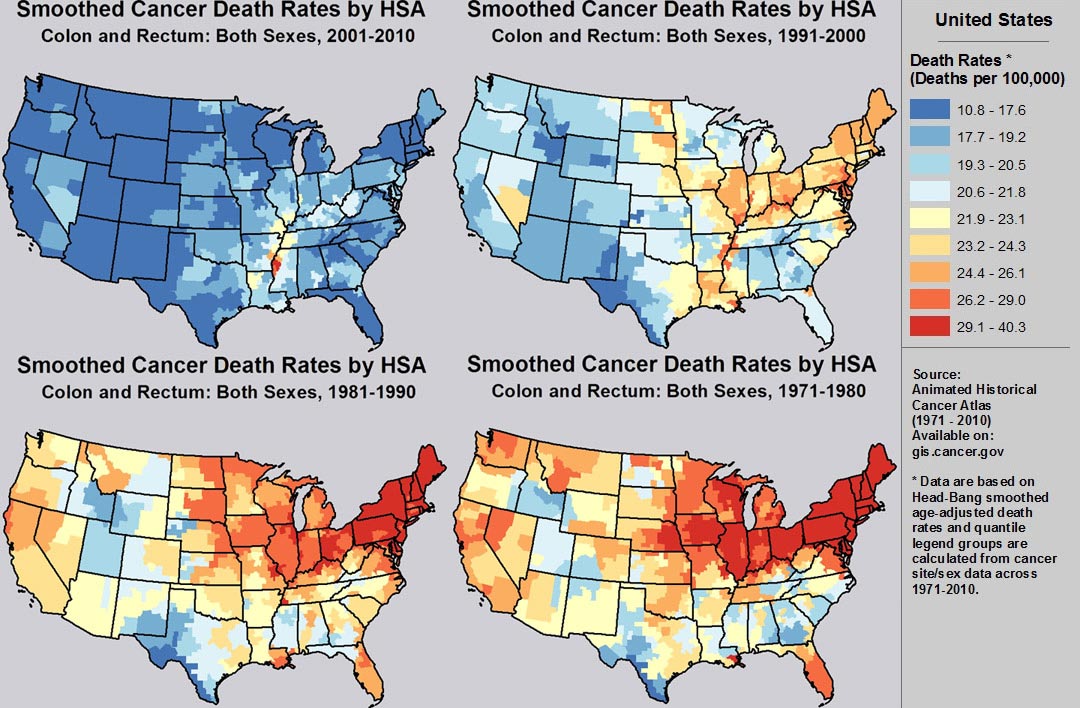
September 2, 2014: Smoothed age-adjusted death rates over time for colorectal cancer, using the Animated Historical Cancer tool.
August 8, 2014: Breast Cancer Genomic Tests Application Type
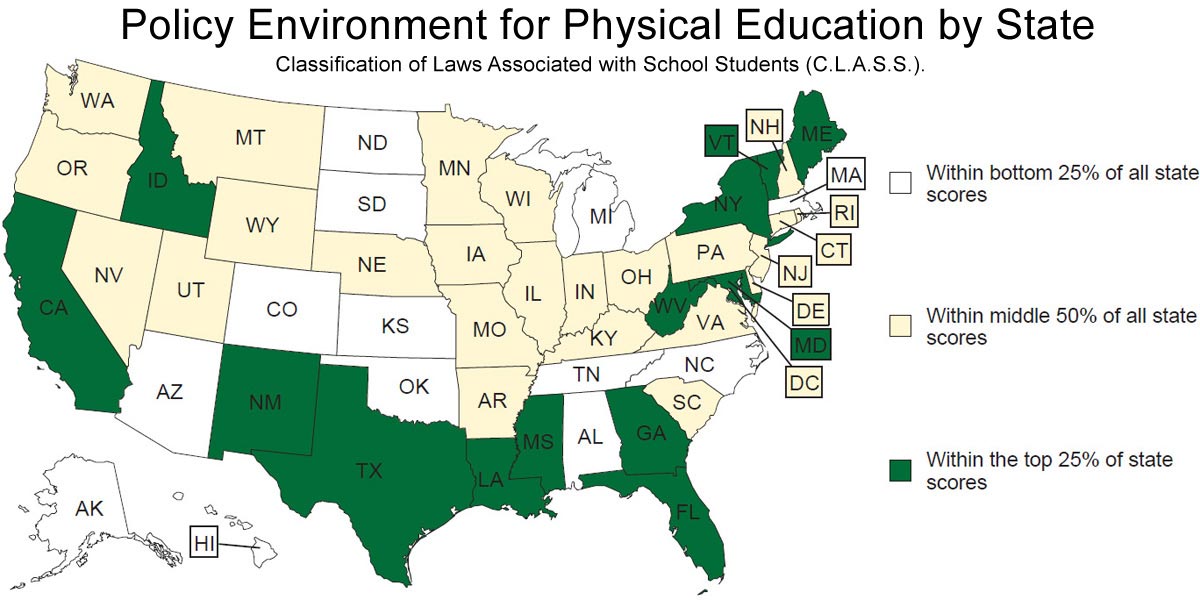
July 17, 2014: Policy Environment for Physical Education by State: Classification of Laws Associated with School Students (CLASS).
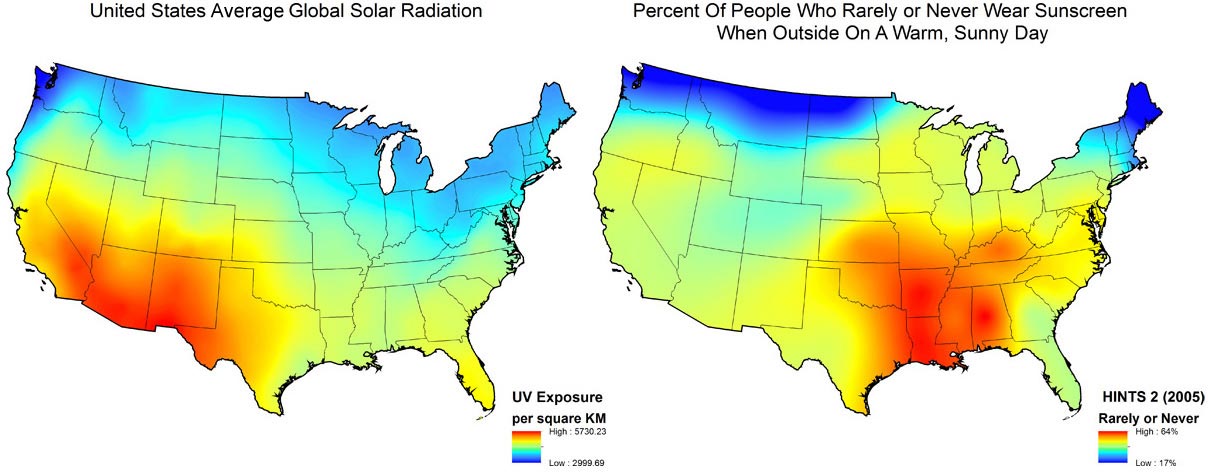
June 19, 2014: United States Average Global Solar Radiation / Percent of People Who Rarely or Never Wear Sunscreen When Outside On A Warm, Sunny Day
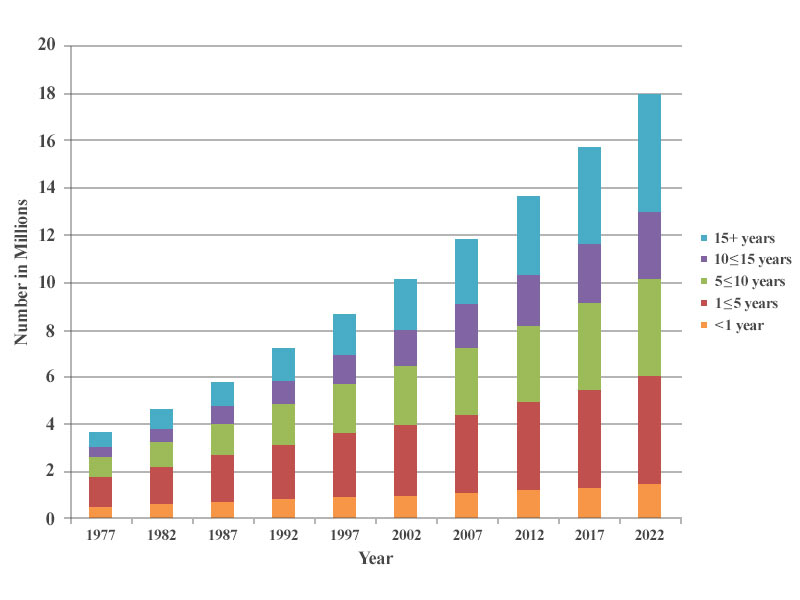
June 1, 2014: Estimated and Project Number Estimated and projected number of cancer survivors in the United States from 1977-2022 by years since diagnosis May 7, 2014 The NCI Director referred to this DCCPS graphic on aging and cancer in his testimony to the U.S. Senate on May 7, 2014
May 7, 2014: The NCI Director referred to this DCCPS graphic on aging and cancer in his testimony to the U.S. Senate on May 7, 2014.