Infographic Archive

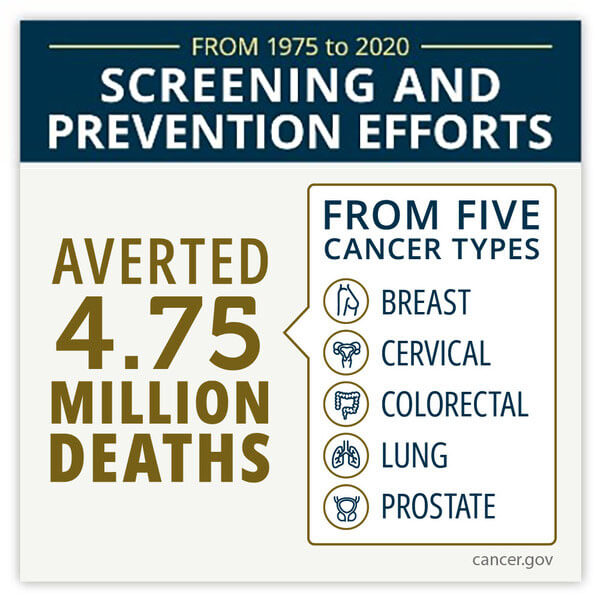
Annual Report to the Nation on the Status of Cancer, Part 1
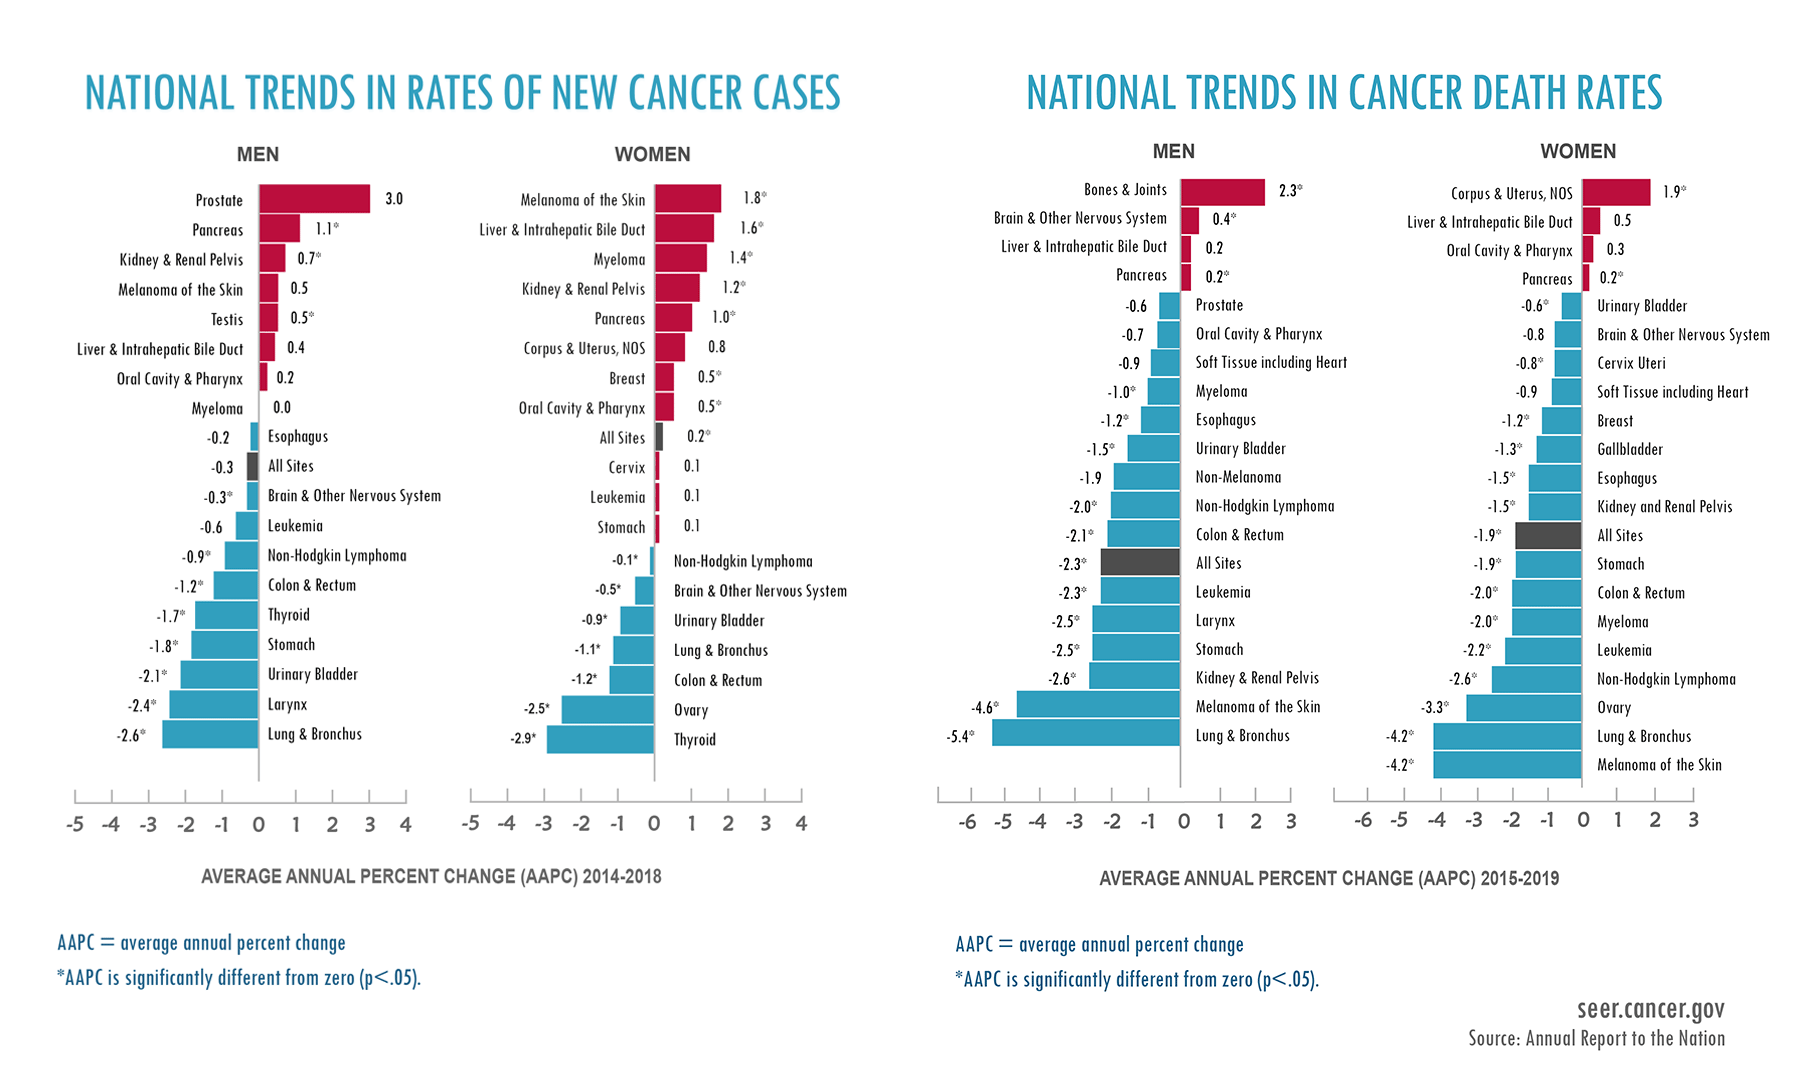
National Trends in rates of new cancer cases and national trends in cancer death rates

Cancer Trends Progress Report: Sun-Protective Behavior
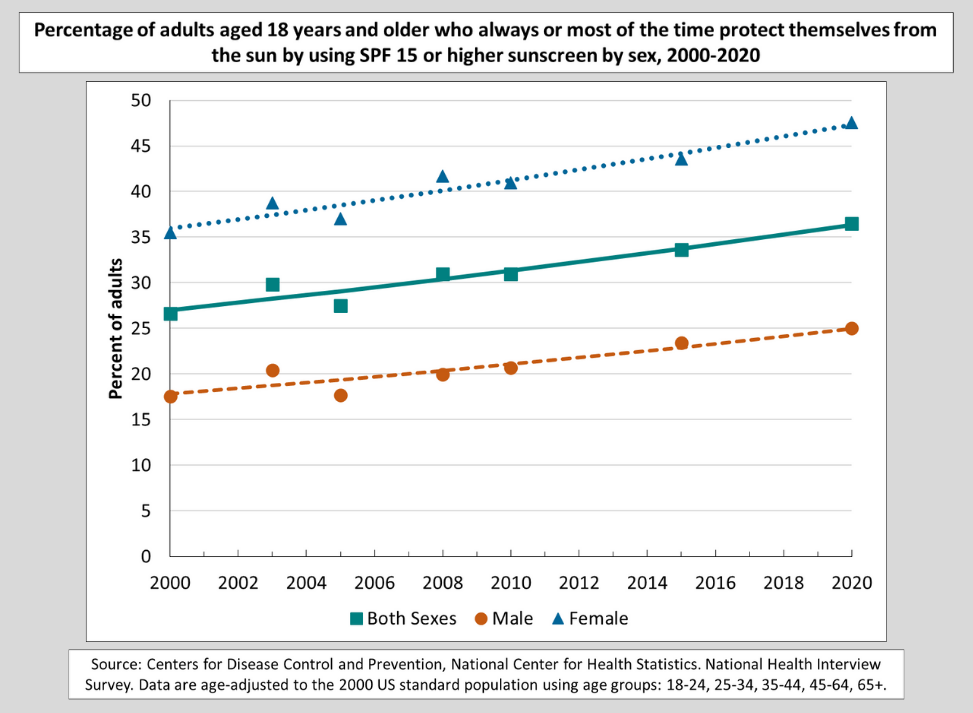
Percentage of adults aged 18 years and older who always or most of the time protect themselves from the sun by using SPF 15 or higher by sex, 2000 to 2020

HINTS Brief 48: Clinical Trial Participation Among U.S. Adults
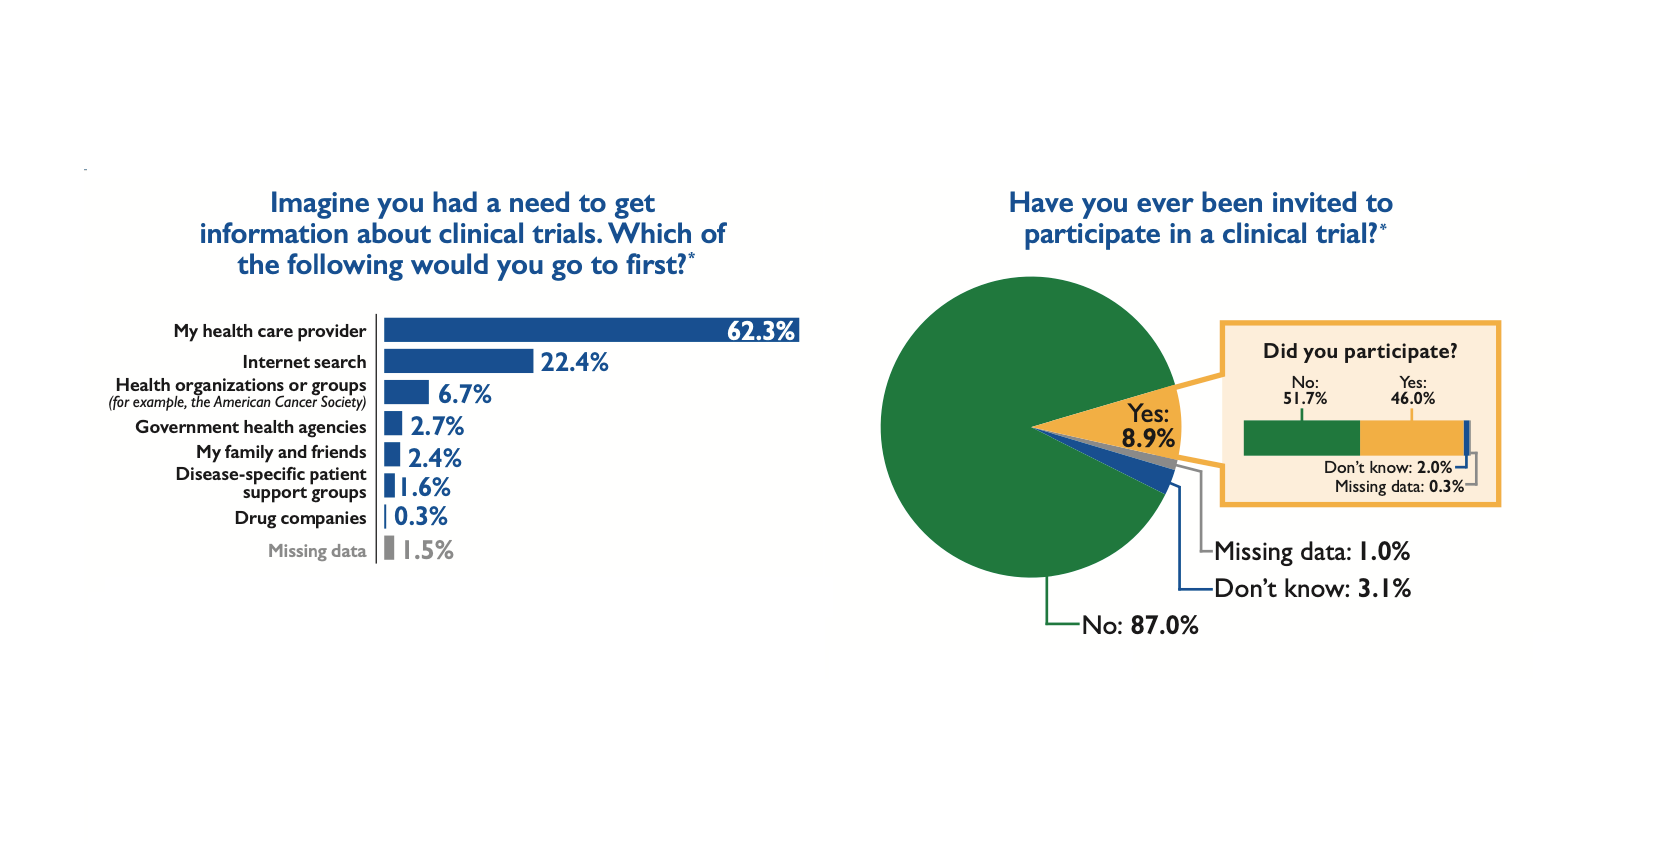
Infographic describing people who had a need to get information about clinical trials and if people had been invited to participate in a clinical trial.

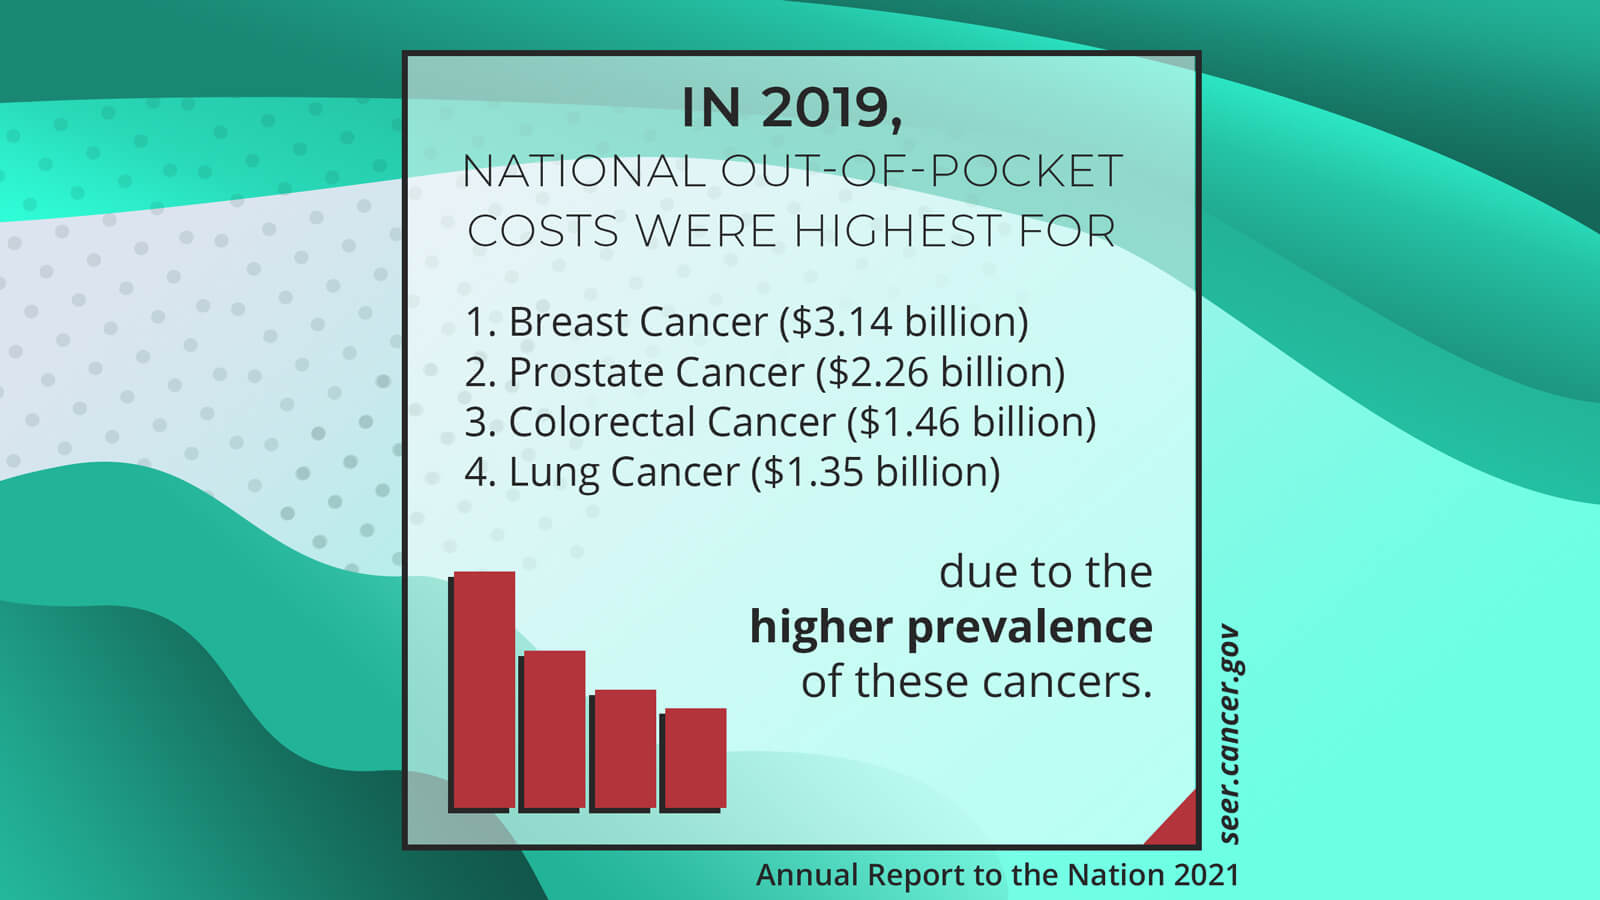
Annual Report to the Nation Part 2

Patient economic burden of cancer care more than $21 billion in the US in 2019.

Percentage of Adults Aged 50-75 Years Who Were Up-to-Date with Colorectal Cancer Screening, Both Sexes, 2000-2019
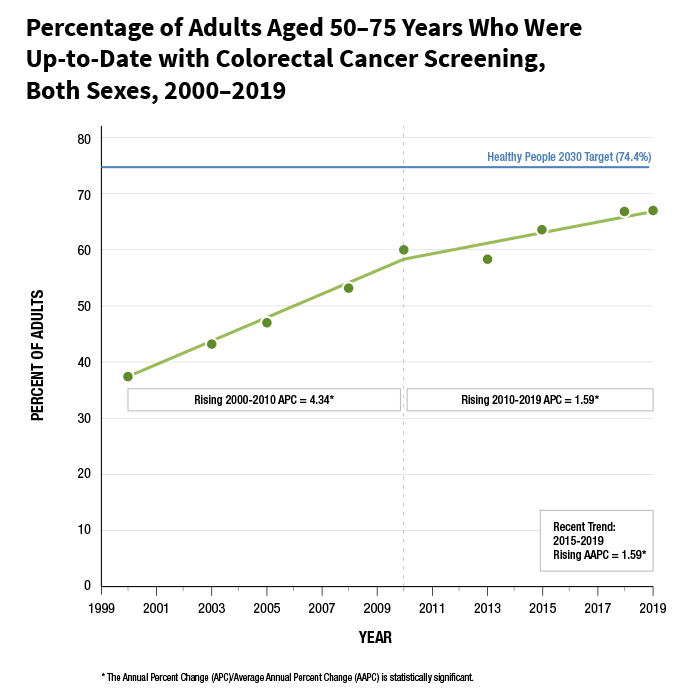
Percentage of Adults Aged 50-75 Years Who Were Up-to-Date with Colorectal Cancer Screening, Both Sexes, 2000-2019

Annual Report to the Nation on the Status of Cancer
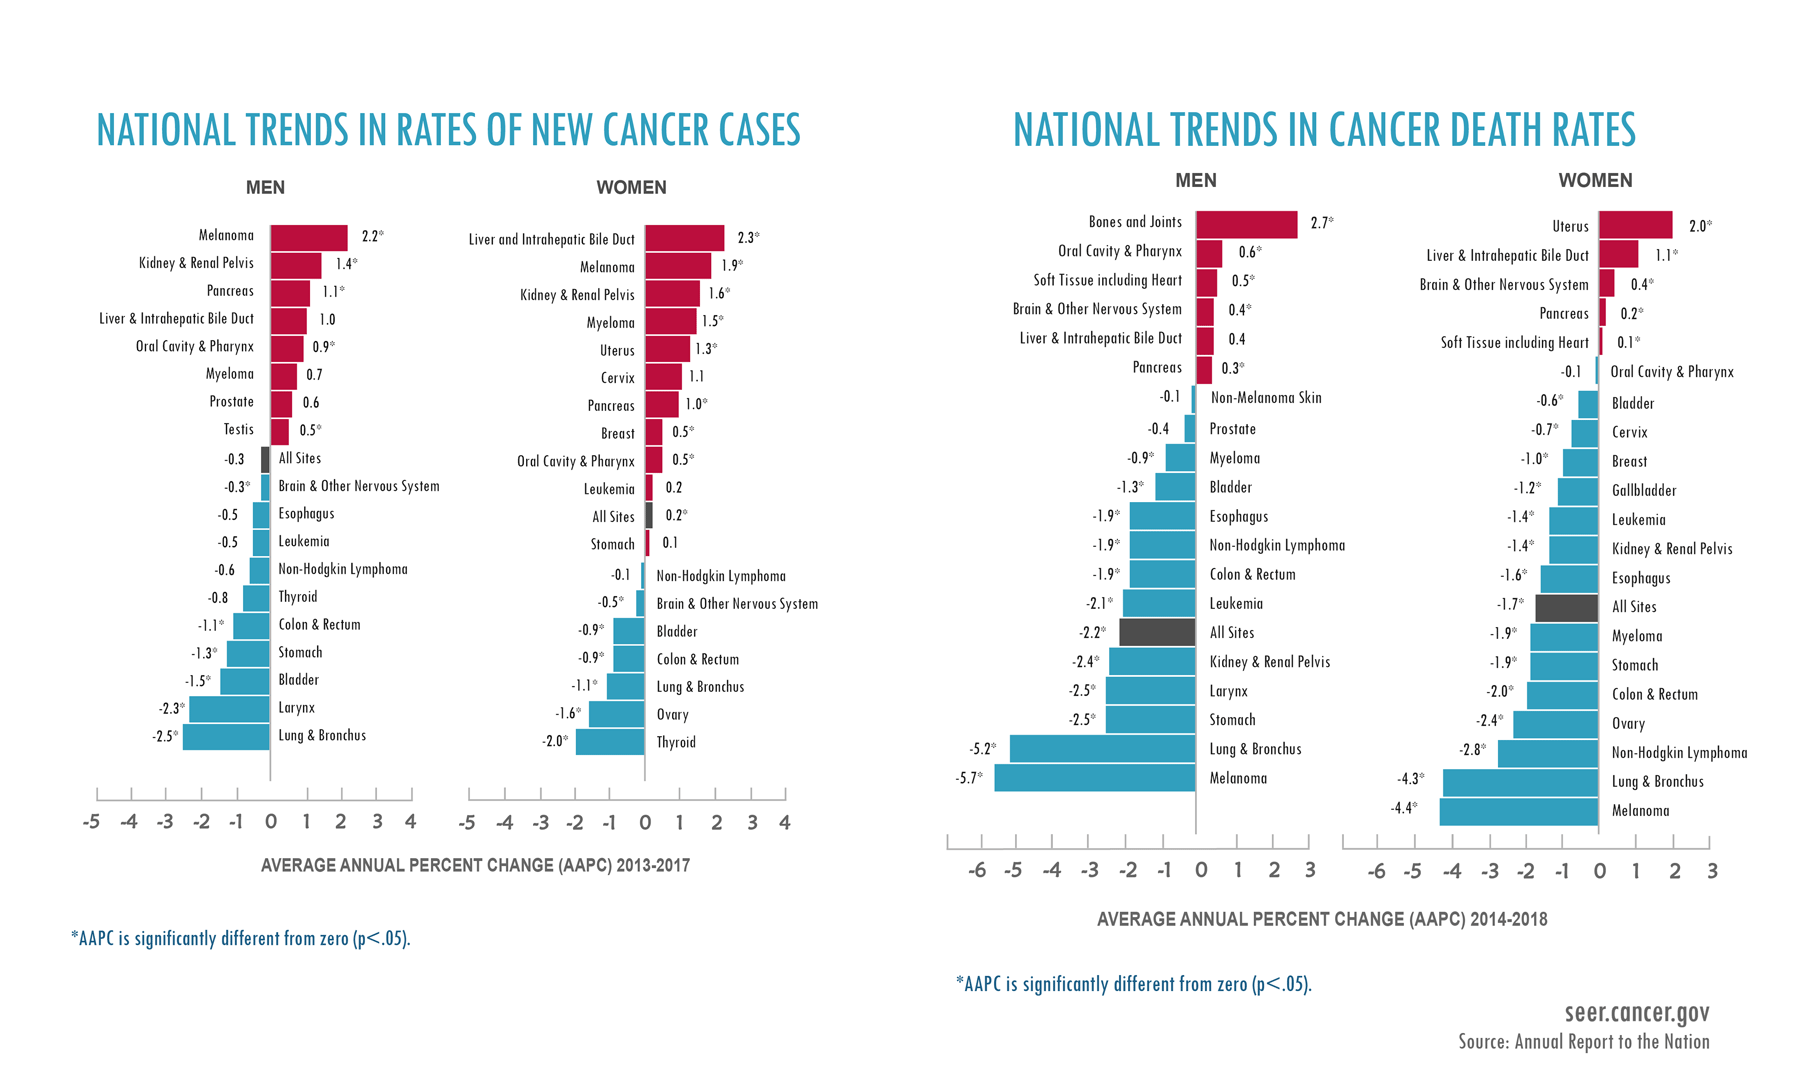
National trends in rates of new cancer cases and cancer death rates

Persistent Poverty and Cancer Mortality Rates: An Analysis of County-level Poverty Designations
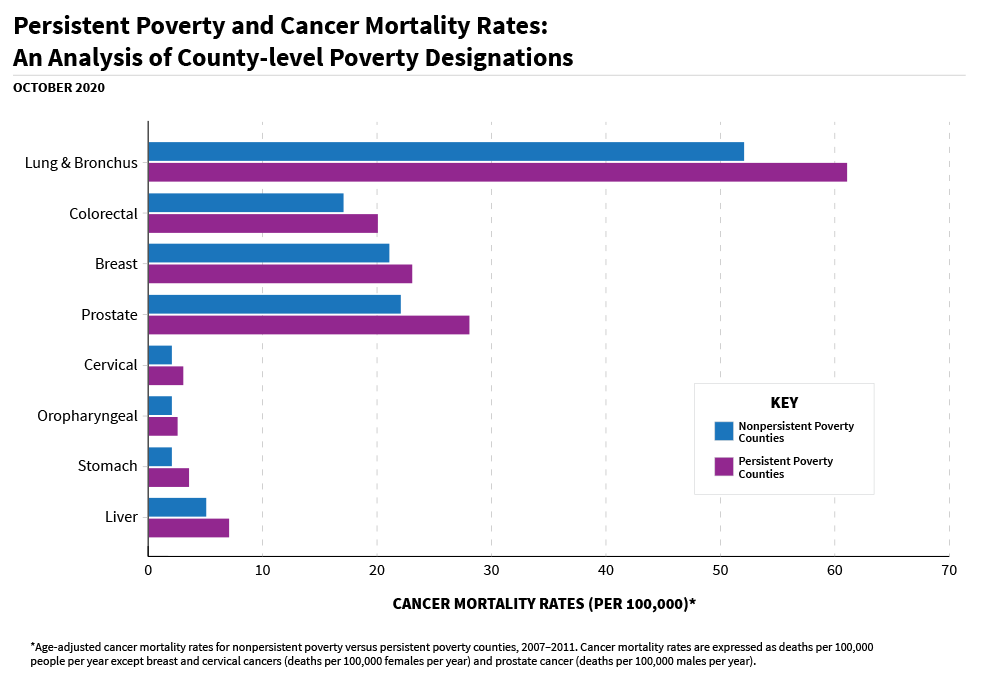
Persistent Poverty and Cancer Mortality Rates: An Analysis of County-level Poverty Designations

Cancer Stat Facts: Cancer Among Adolescents and Young Adults (AYAs) (Ages 15–39)
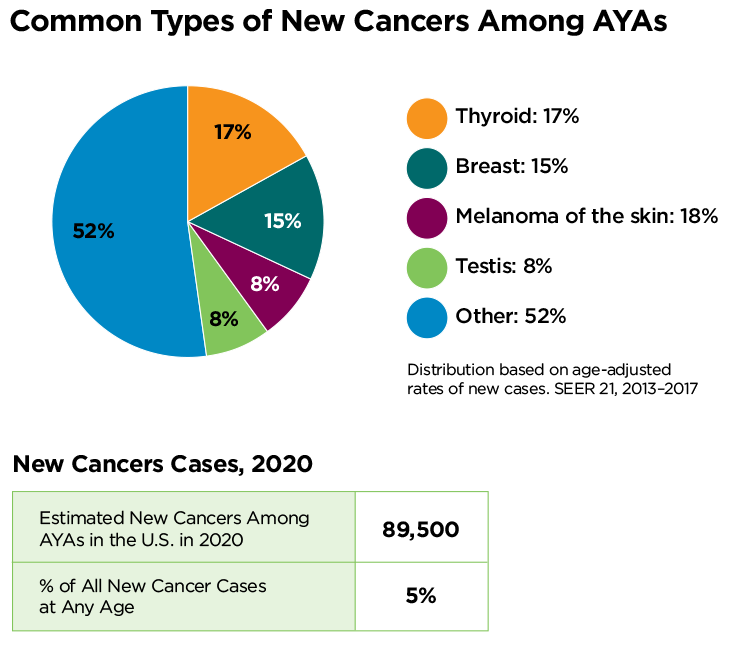
Common types of new cancers among AYAs. Distribution based on age-adjusted rates of new cases available in SEER 21, 2013-2017 report

Non-Small Cell Lung Cancer (NSCLC) Survival Trends by Race-ethnicity and Gender, SEER-18 excluding Alaska. 2001-2016.
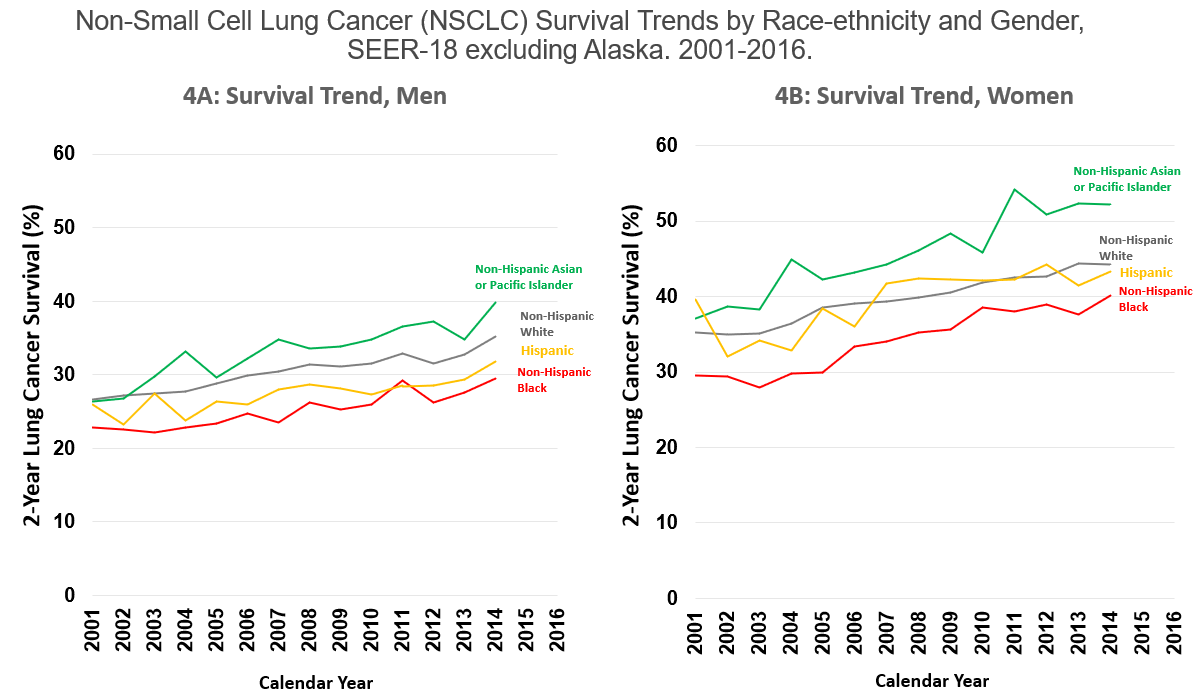
Non-Small Cell Lung Cancer (NSCLC) Survival Trends by Race-ethnicity and Gender, SEER-18 excluding Alaska. 2001-2016.
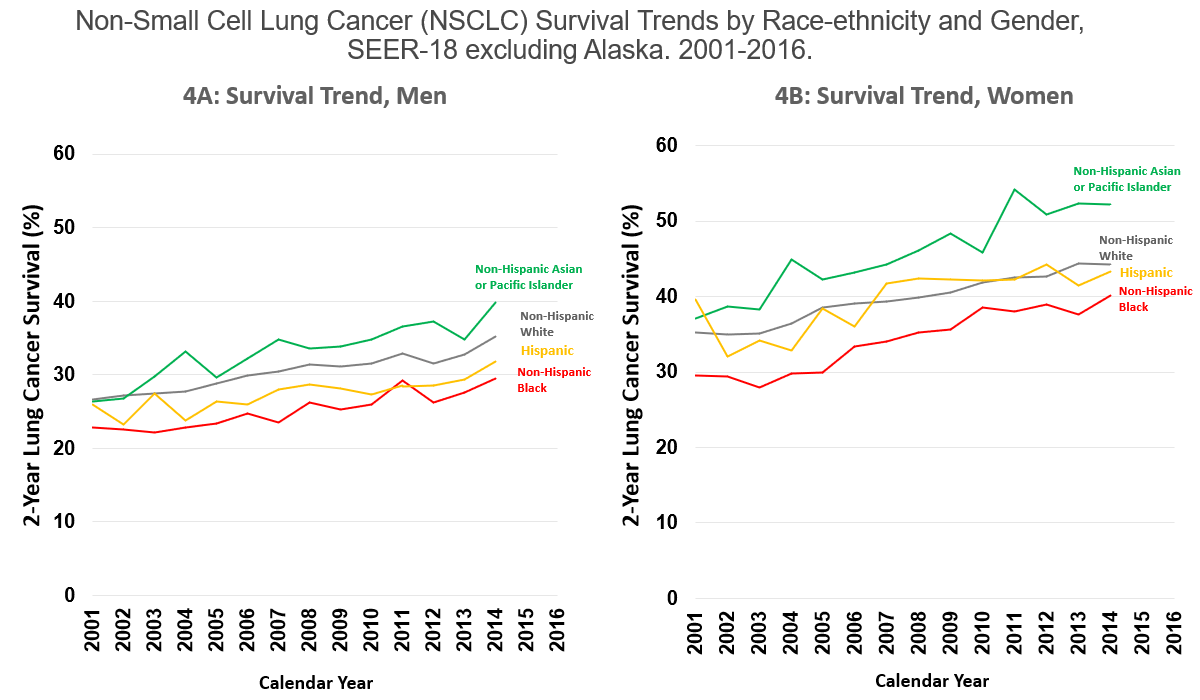
Non-Small Cell Lung Cancer (NSCLC) Survival Trends by Race-ethnicity and Gender, SEER-18 excluding Alaska. 2001-2016.

Non-Small Cell Lung Cancer (NSCLC) Survival Trends by Race-ethnicity and Gender, SEER-18 excluding Alaska. 2001-2016.

Annual Report to the Nation on the Status of Cancer
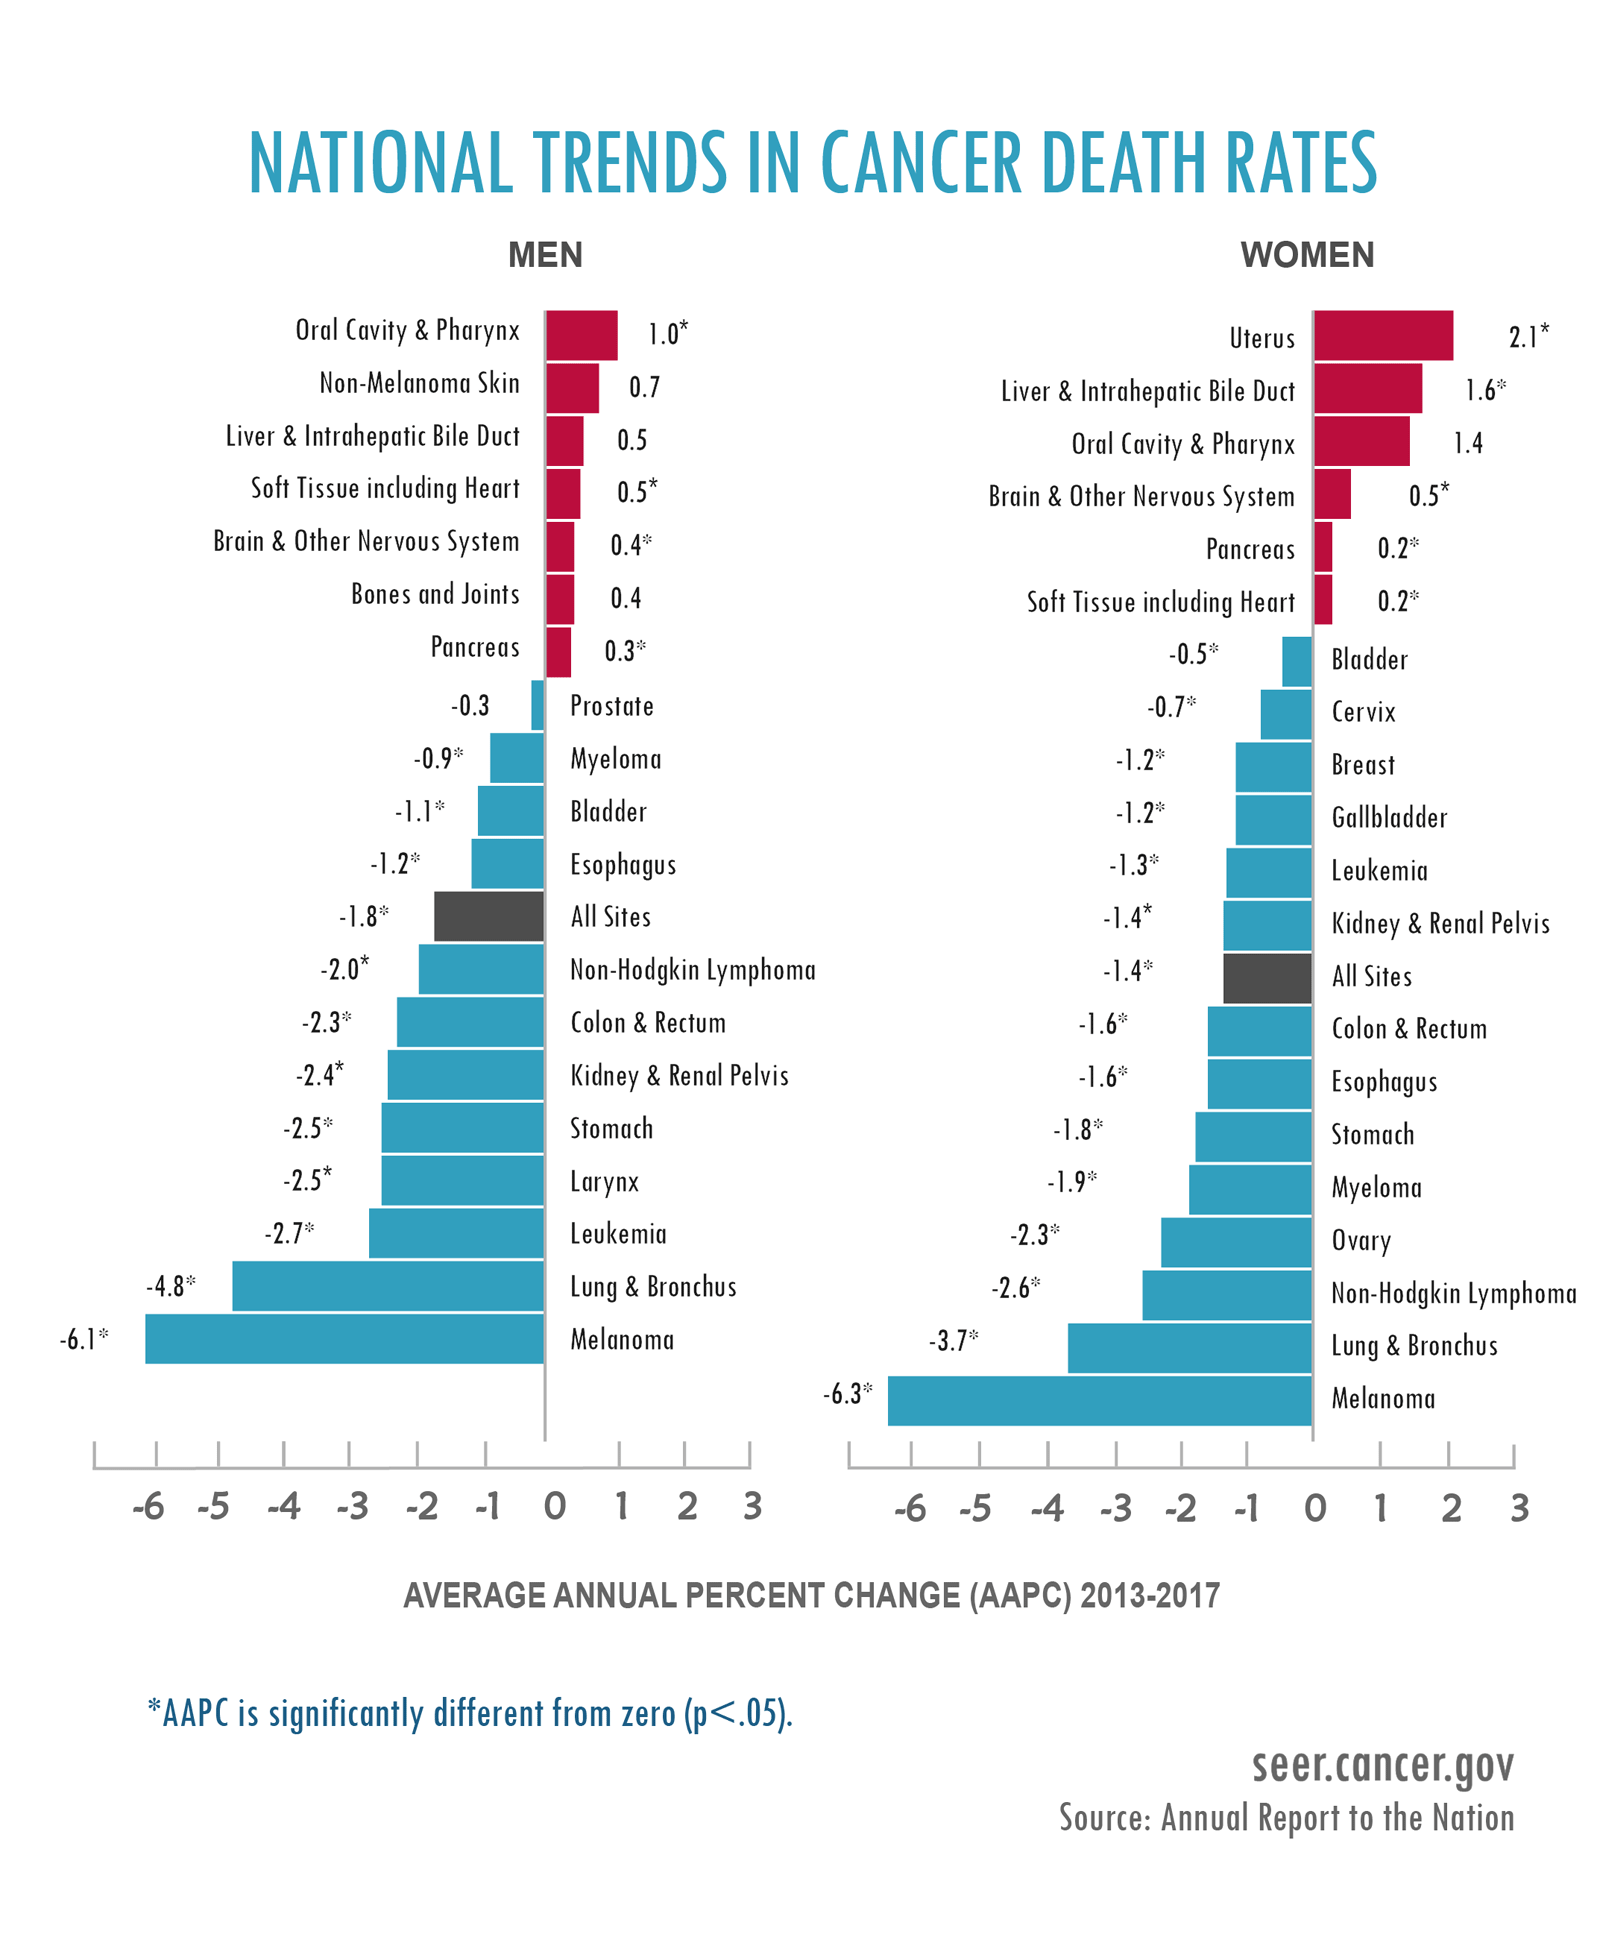
The Annual Report to the Nation on the Status of Cancer is an update of rates for new cases and deaths as well as trends for the most common cancers in the United States. This year's Special Section focuses on progress toward Healthy People 2020 objectives related to four common cancers (lung, colorectal, female breast, and prostate).

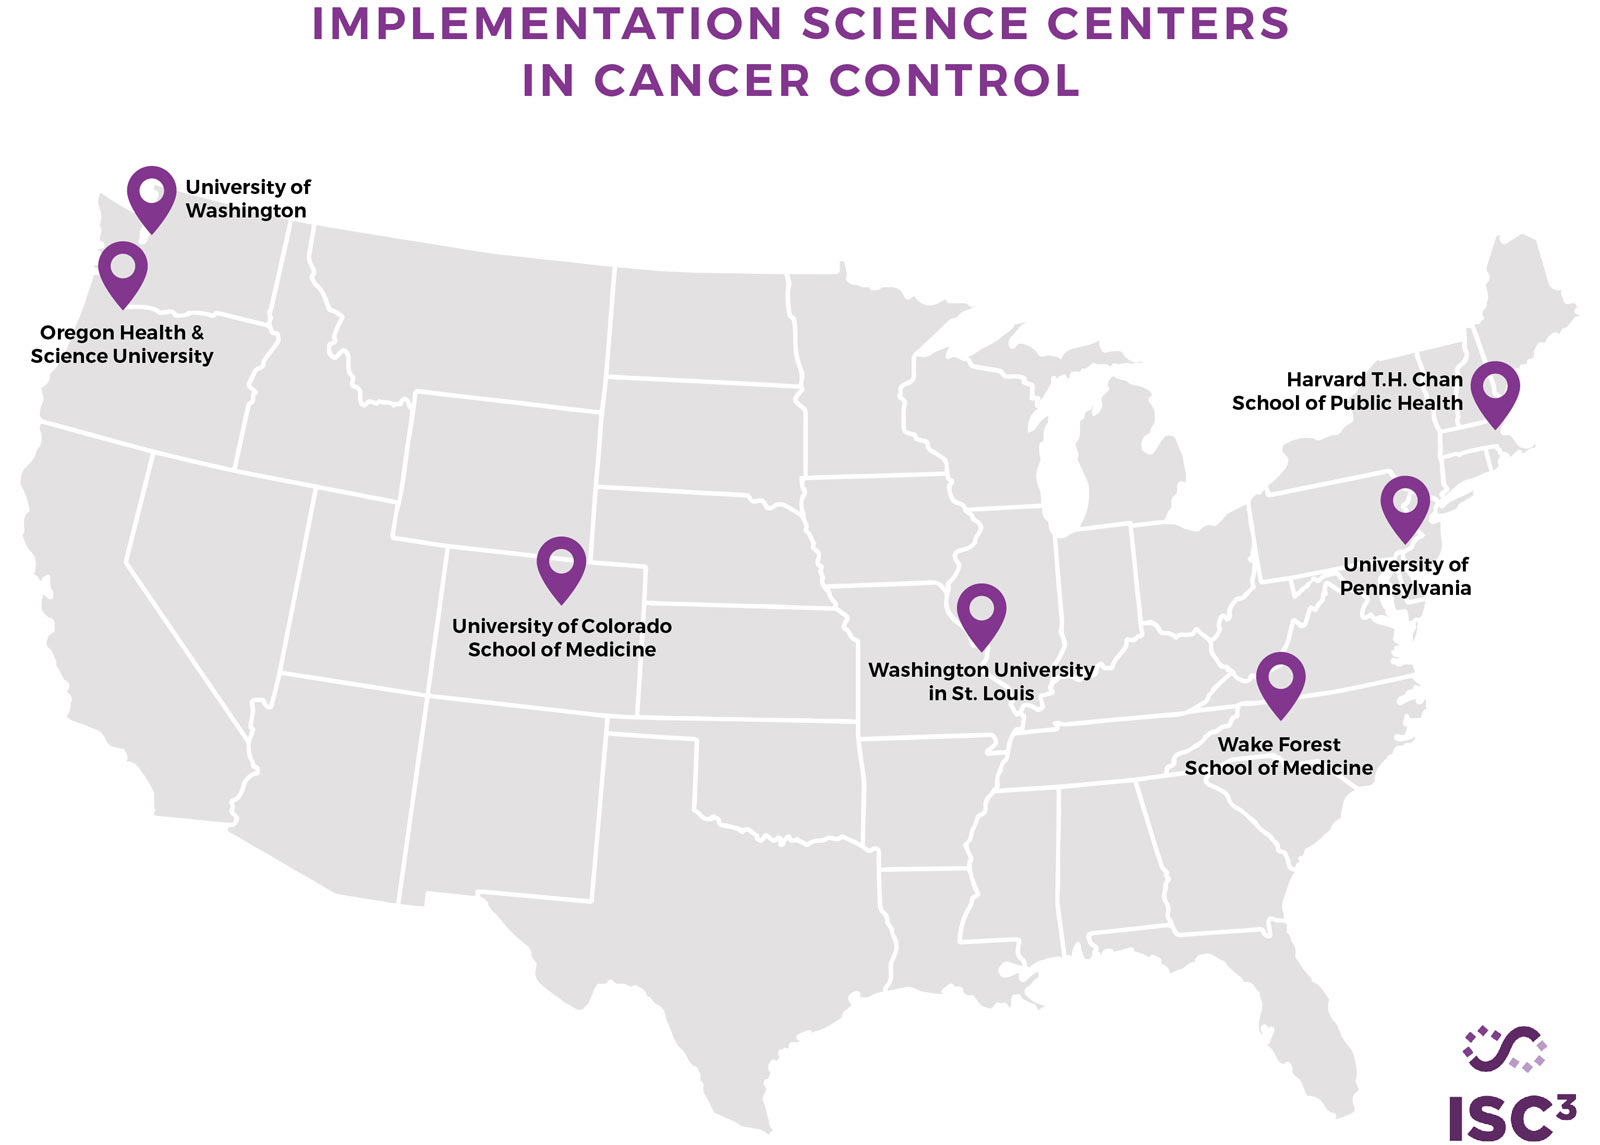
Implementation Science Centers (P50s)

The ISC3 Program is composed of six Centers funded by RFA-19-005 and RFA-19-006.

Awareness of Palliative Care among U.S. adults
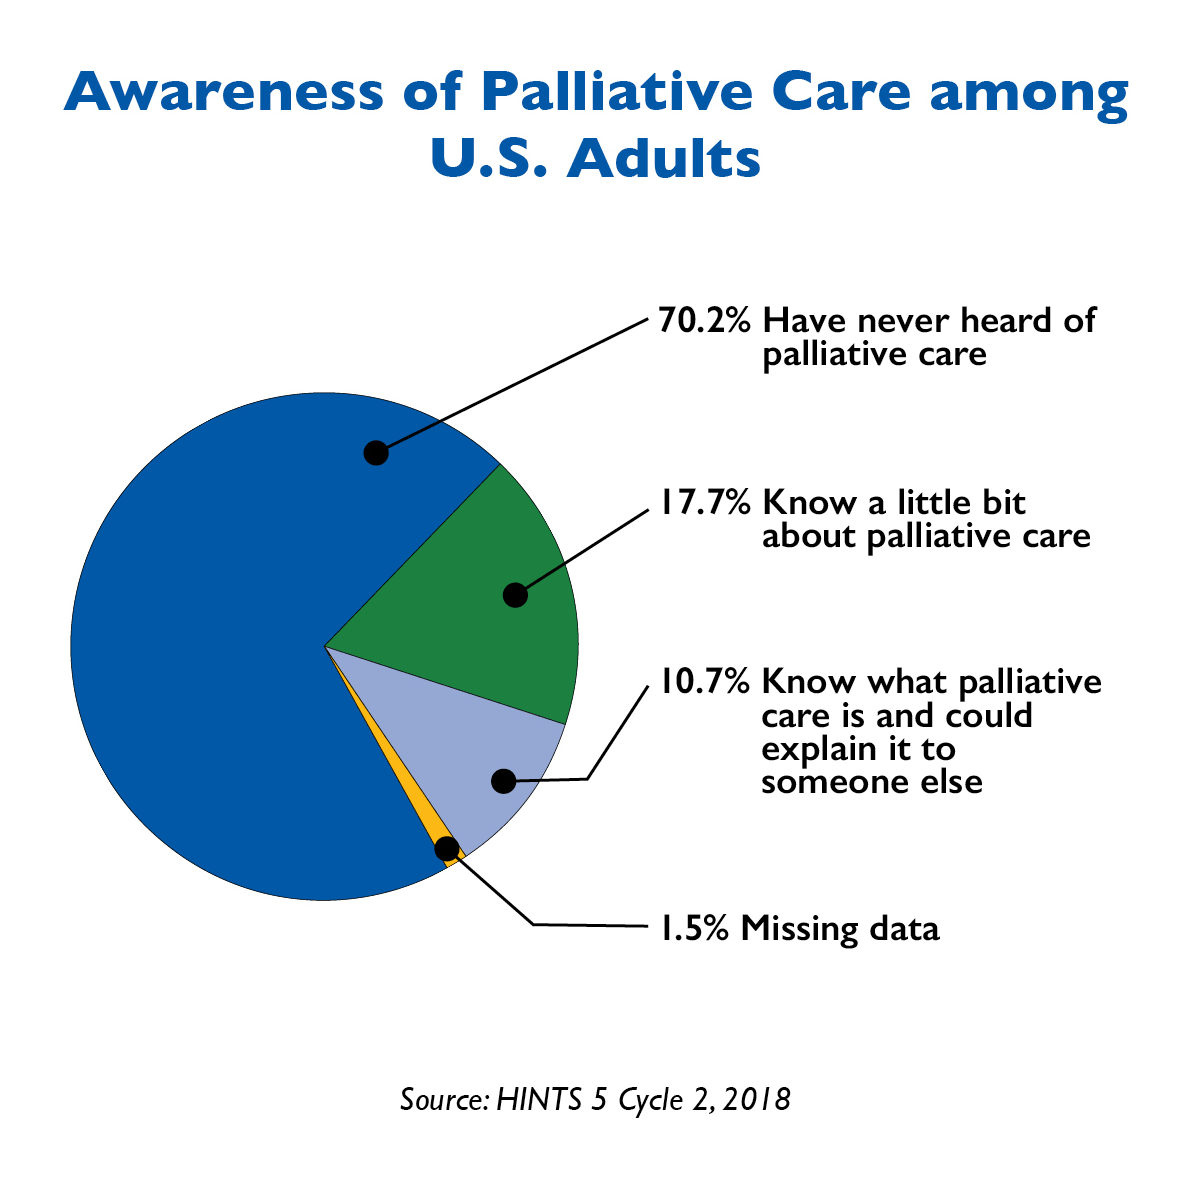
Awareness of Palliative Care among U.S. adults. 70.2 percent have never heard of pallative care. 17.7 percent knwo a little bit about pallative care. 10.7 percent know what palliative care is and could explain it to someone elese. 1.5 percent missing data.

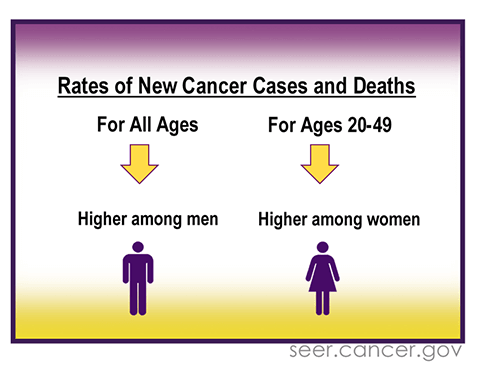
Rates of New Cancer Cases and Deaths

Rates of new cancer cases and deaths. For all ages, it is higher among men. For ages 20 to 49, it is higher among women.

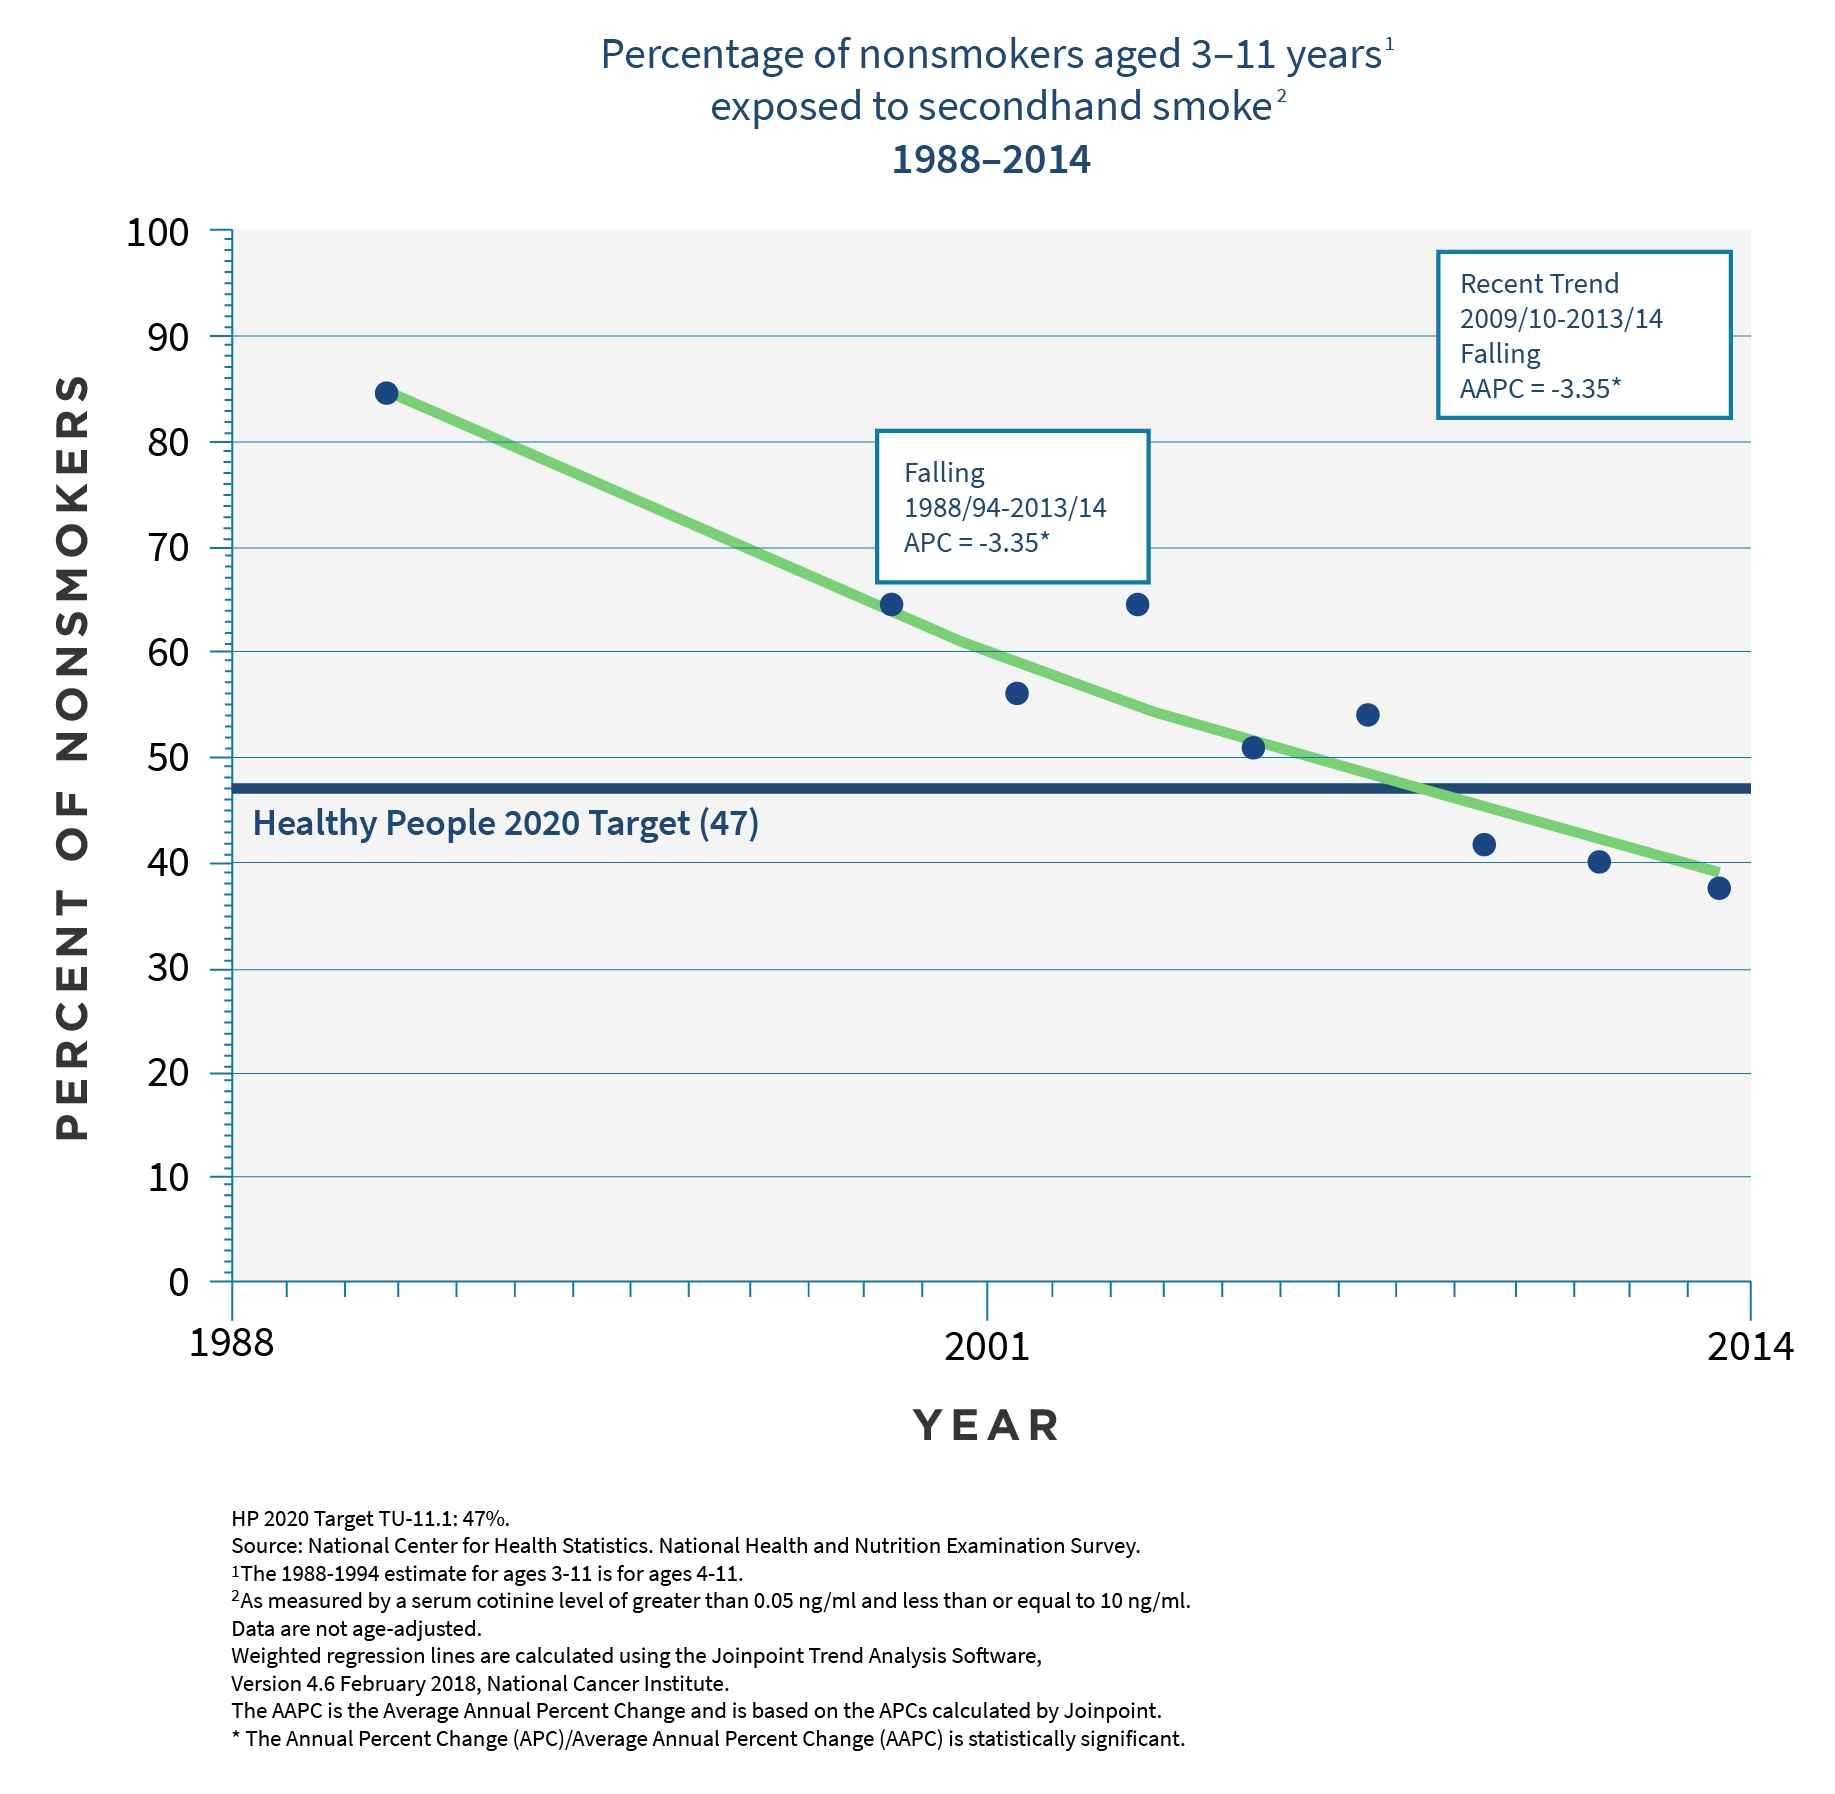
Percentage of nonsmokers aged 3 to 11 years old, exposed to secondhand smoke between 1988 and 2014
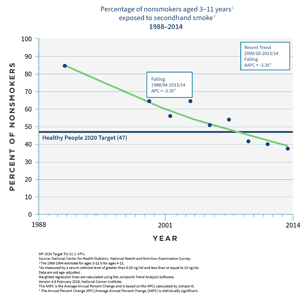
Percentage of nonsmokers aged 3 to 11 years old, exposed to secondhand smoke between 1988 and 2014

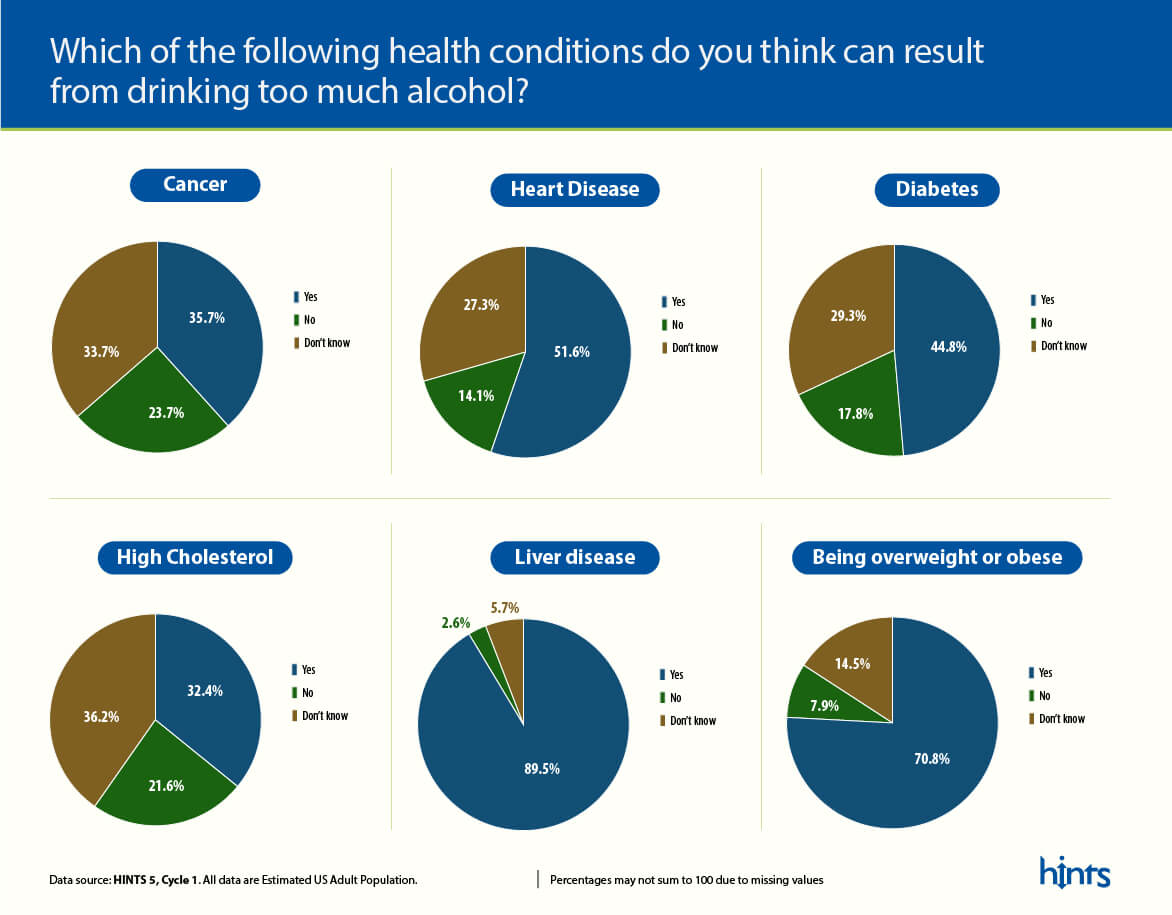
Which of the following health conditions do you think can result from drinking too much alcohol?
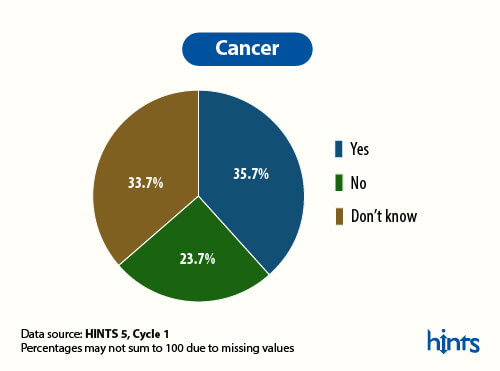
Which of the following health conditions do you think an result from drinking too much alcohol?

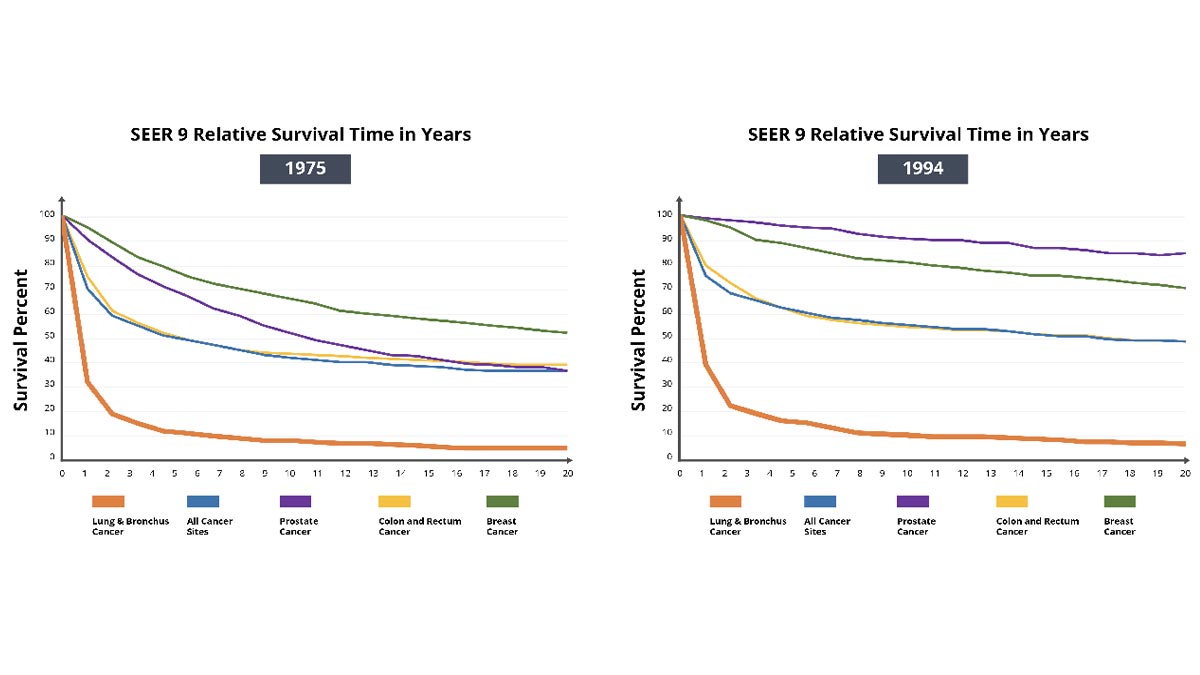
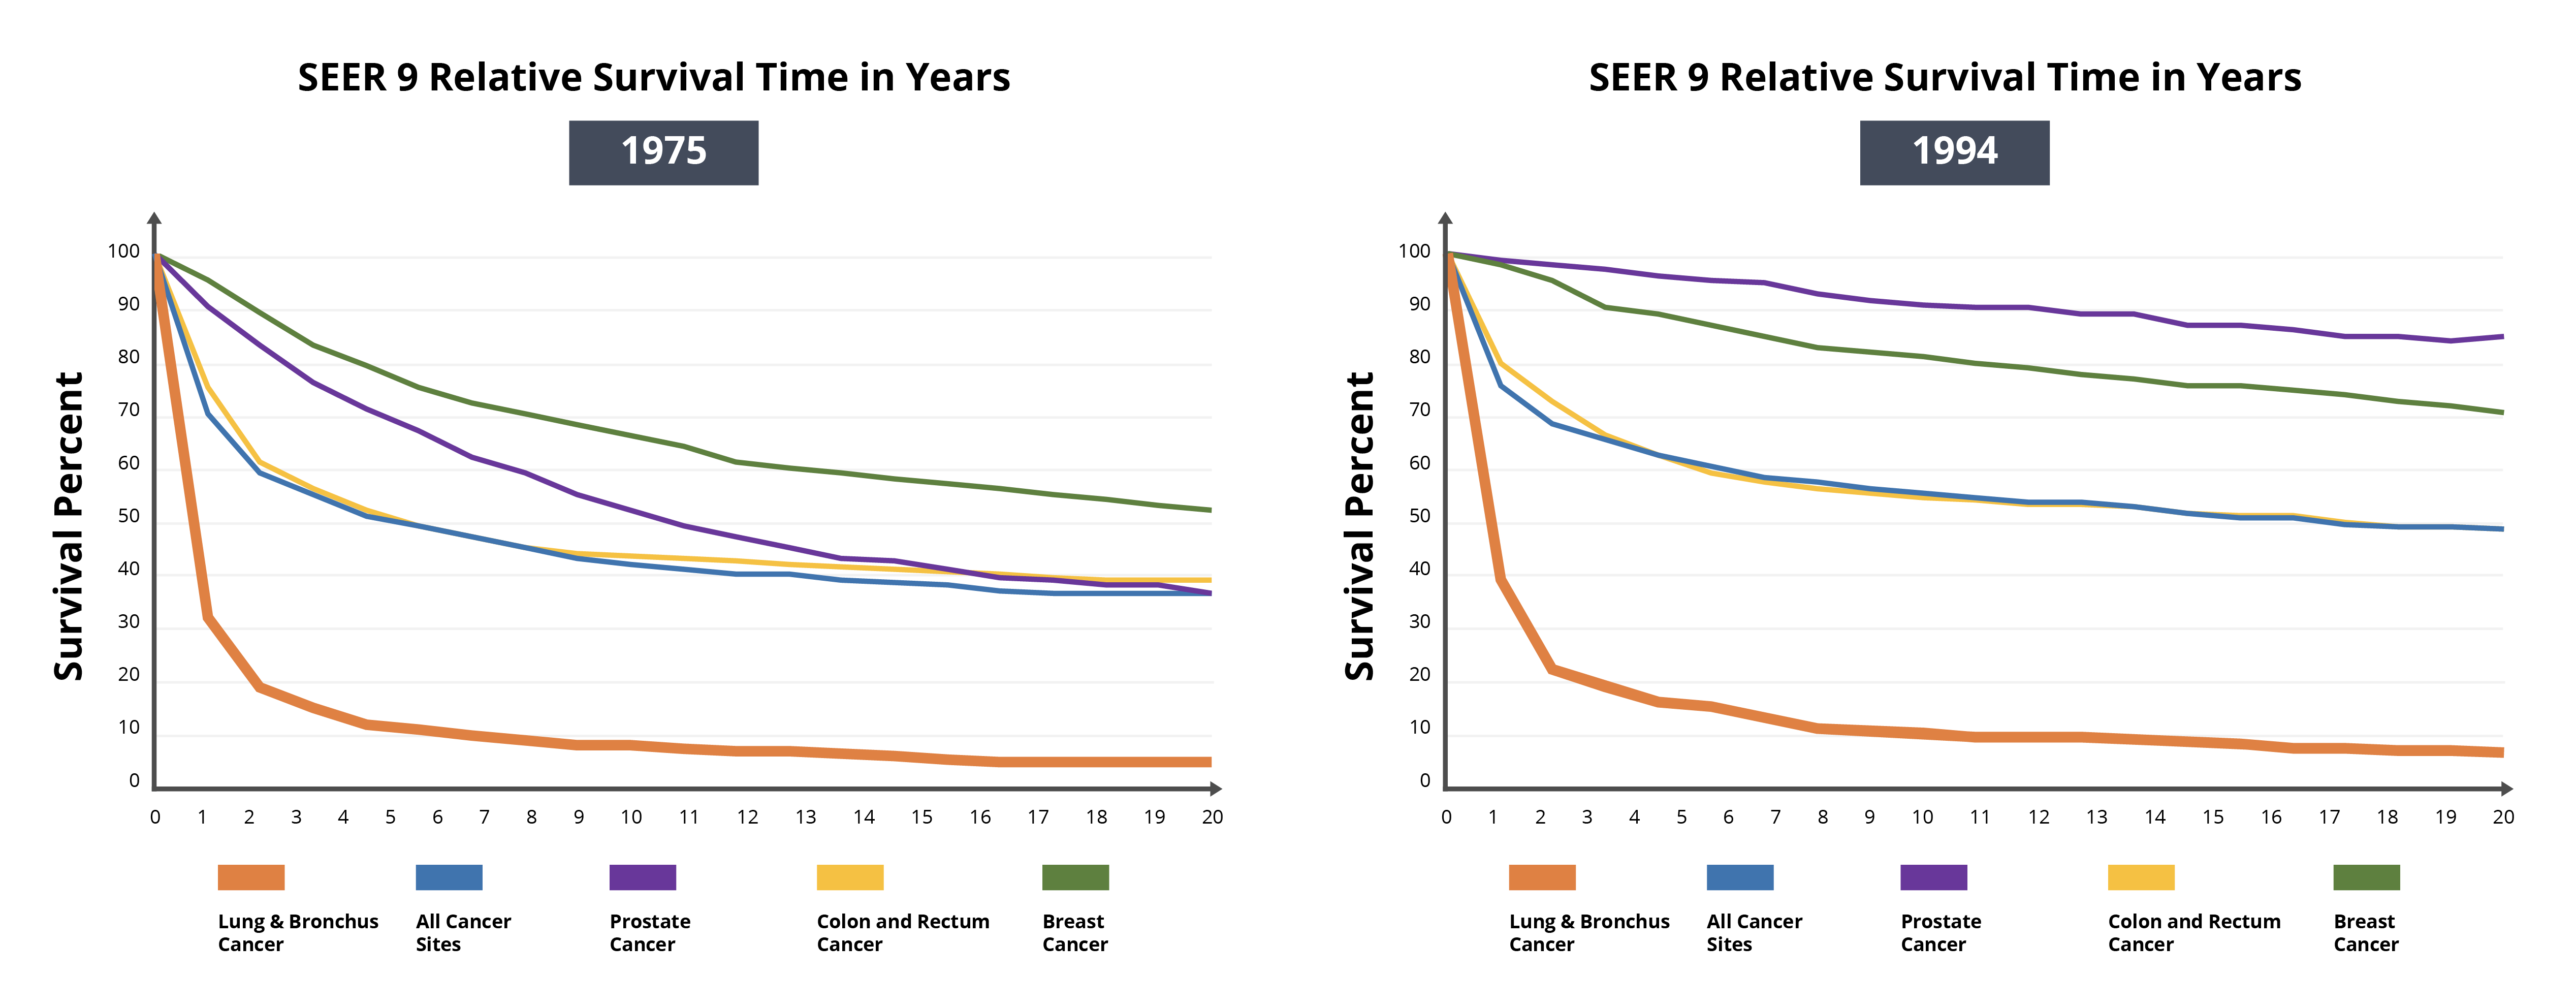
Tobacco Use & Lung Cancer

SEER 9 Relative Survival Times in Years

Five-Year Survival for Selected Cancers Among Children
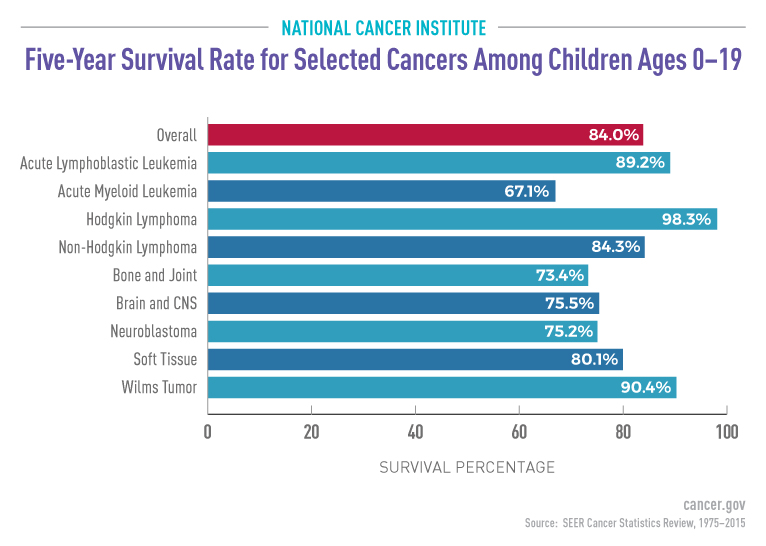
Five-year survival rate for selected cancers among children ages 0-19

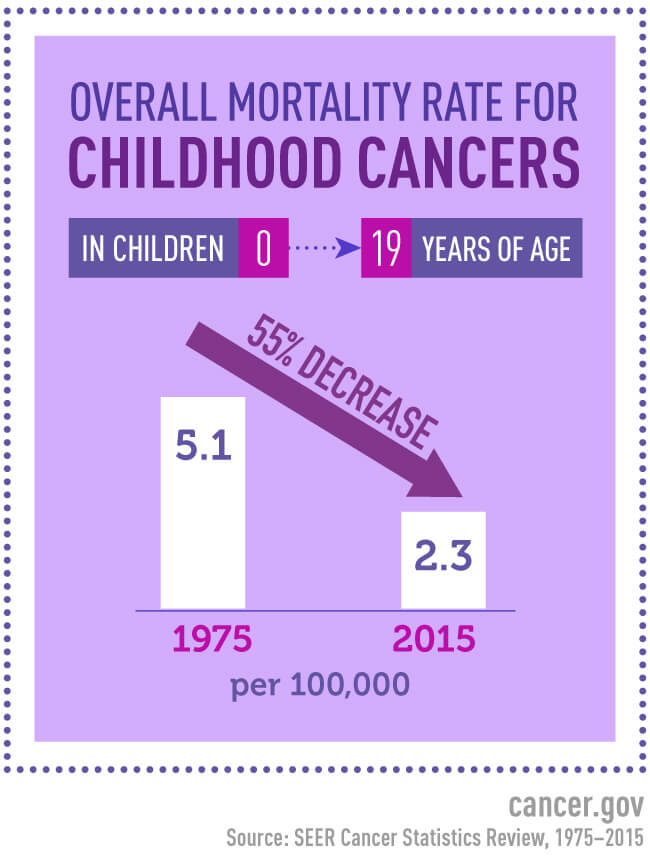
Overall Mortality Rate for Childhood Cancer
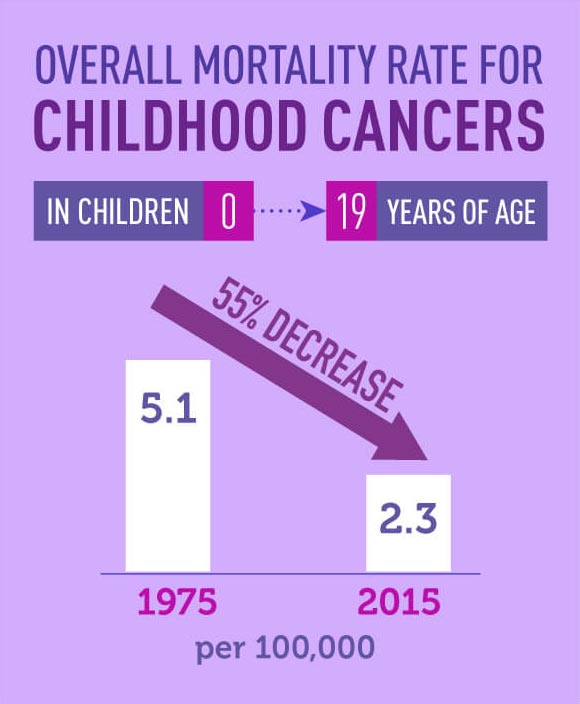
Five-year survival rate for selected cancers among children ages 0-19

National Trends for Childhood Cancers (Age 0-19)
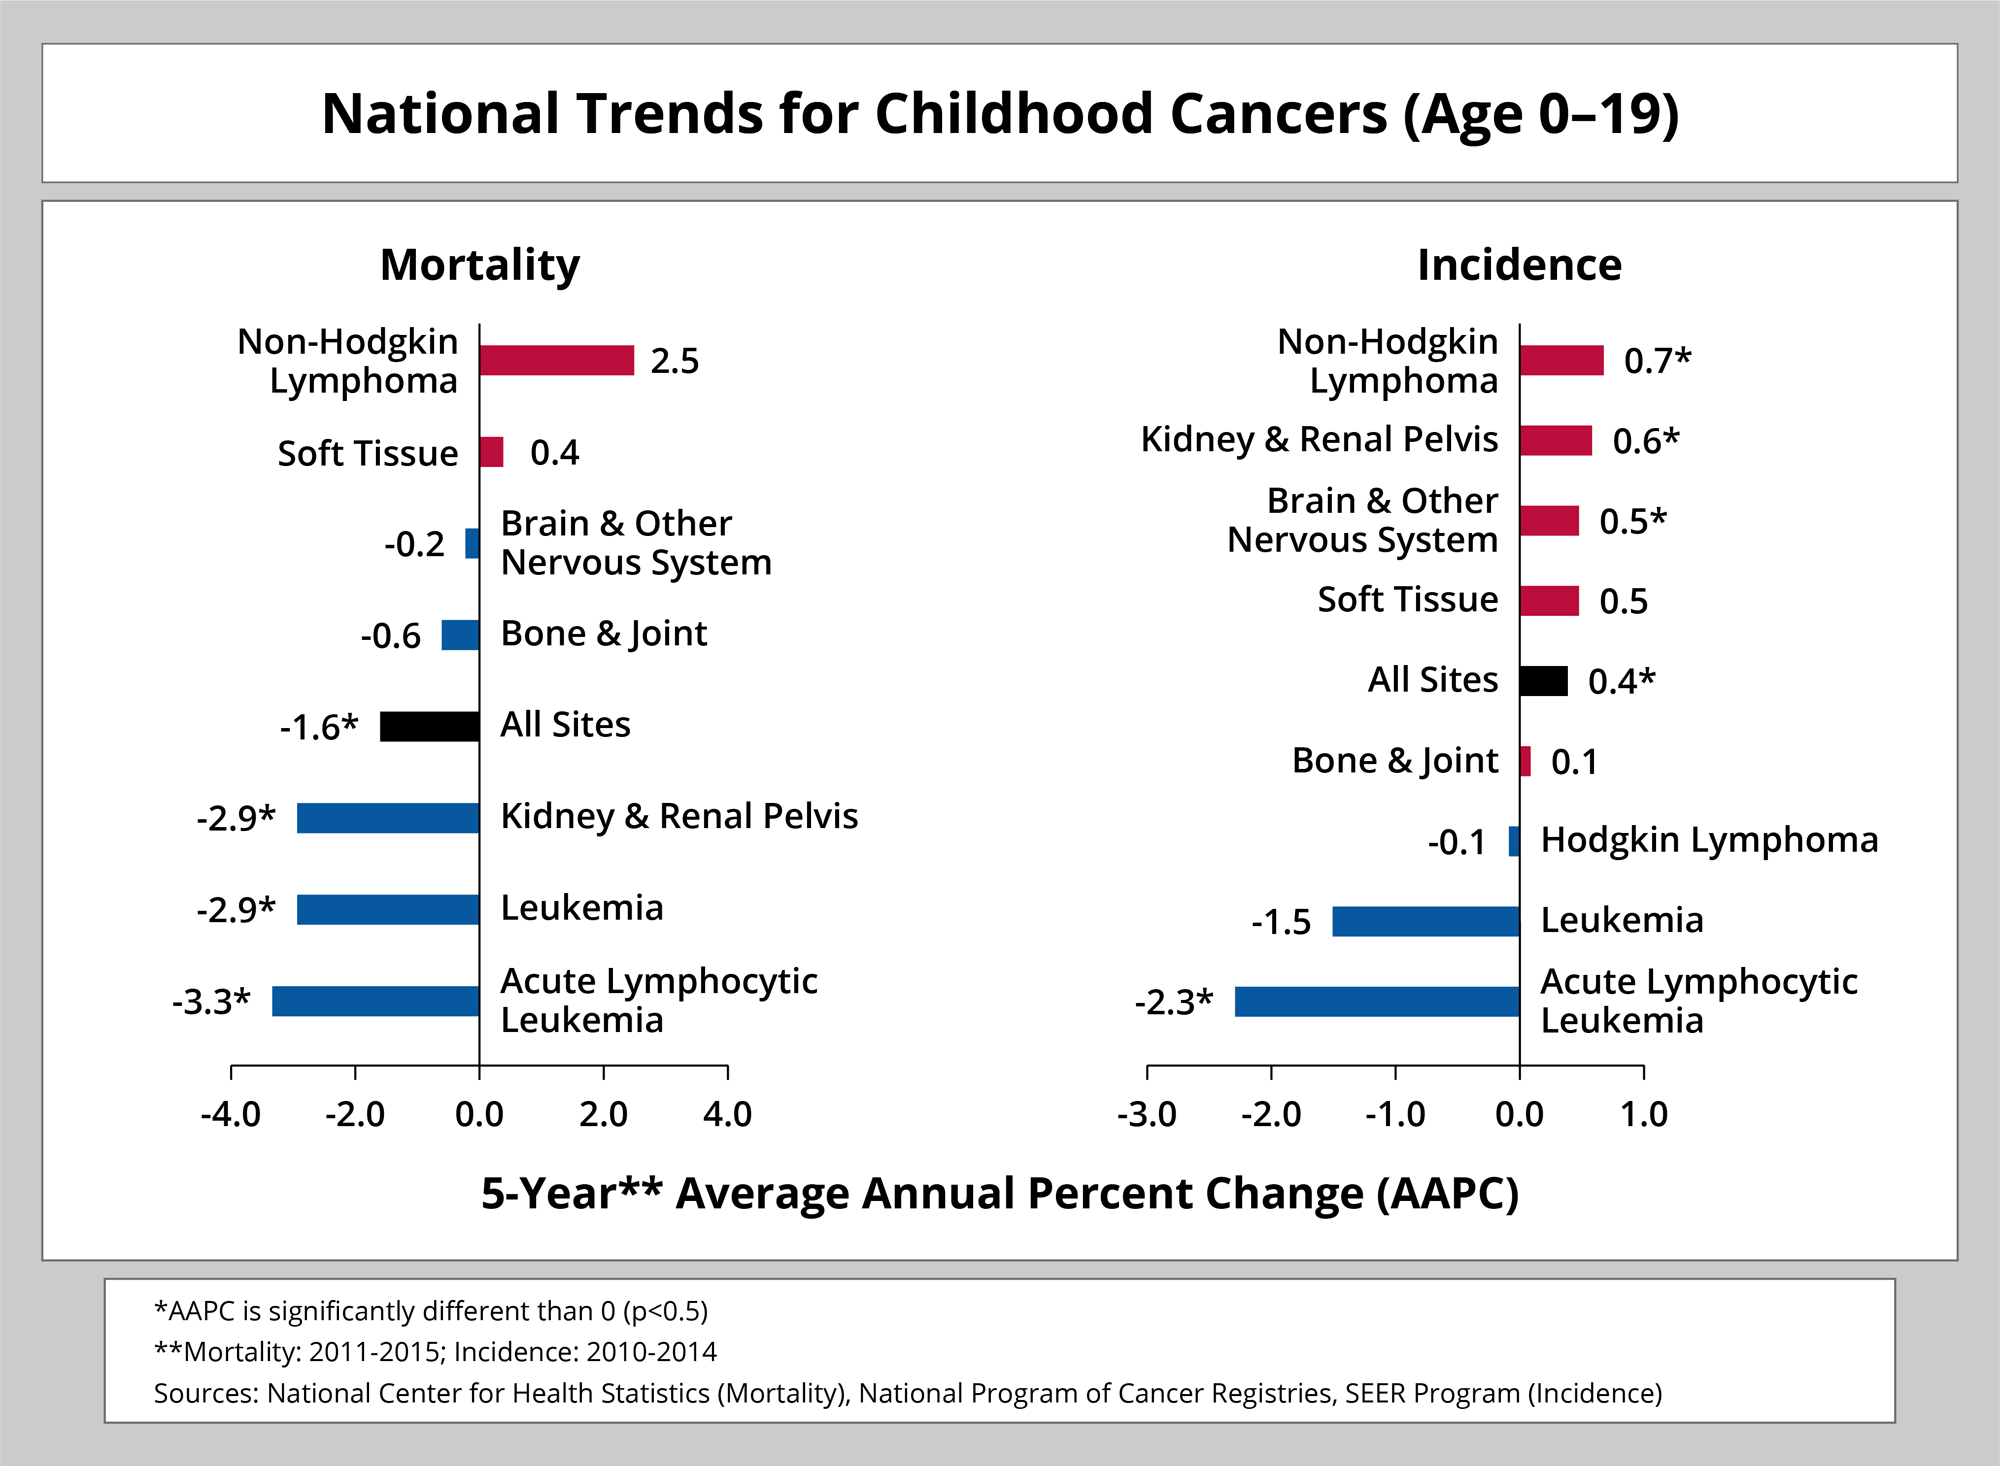
National Trends for Childhood Cancers (Age 0-19). 5-Year** Average Annual Precent Change (AAPC)

5-Year Survival Rates for 2007 – 2013 for Stage I of the Most Common Cancers
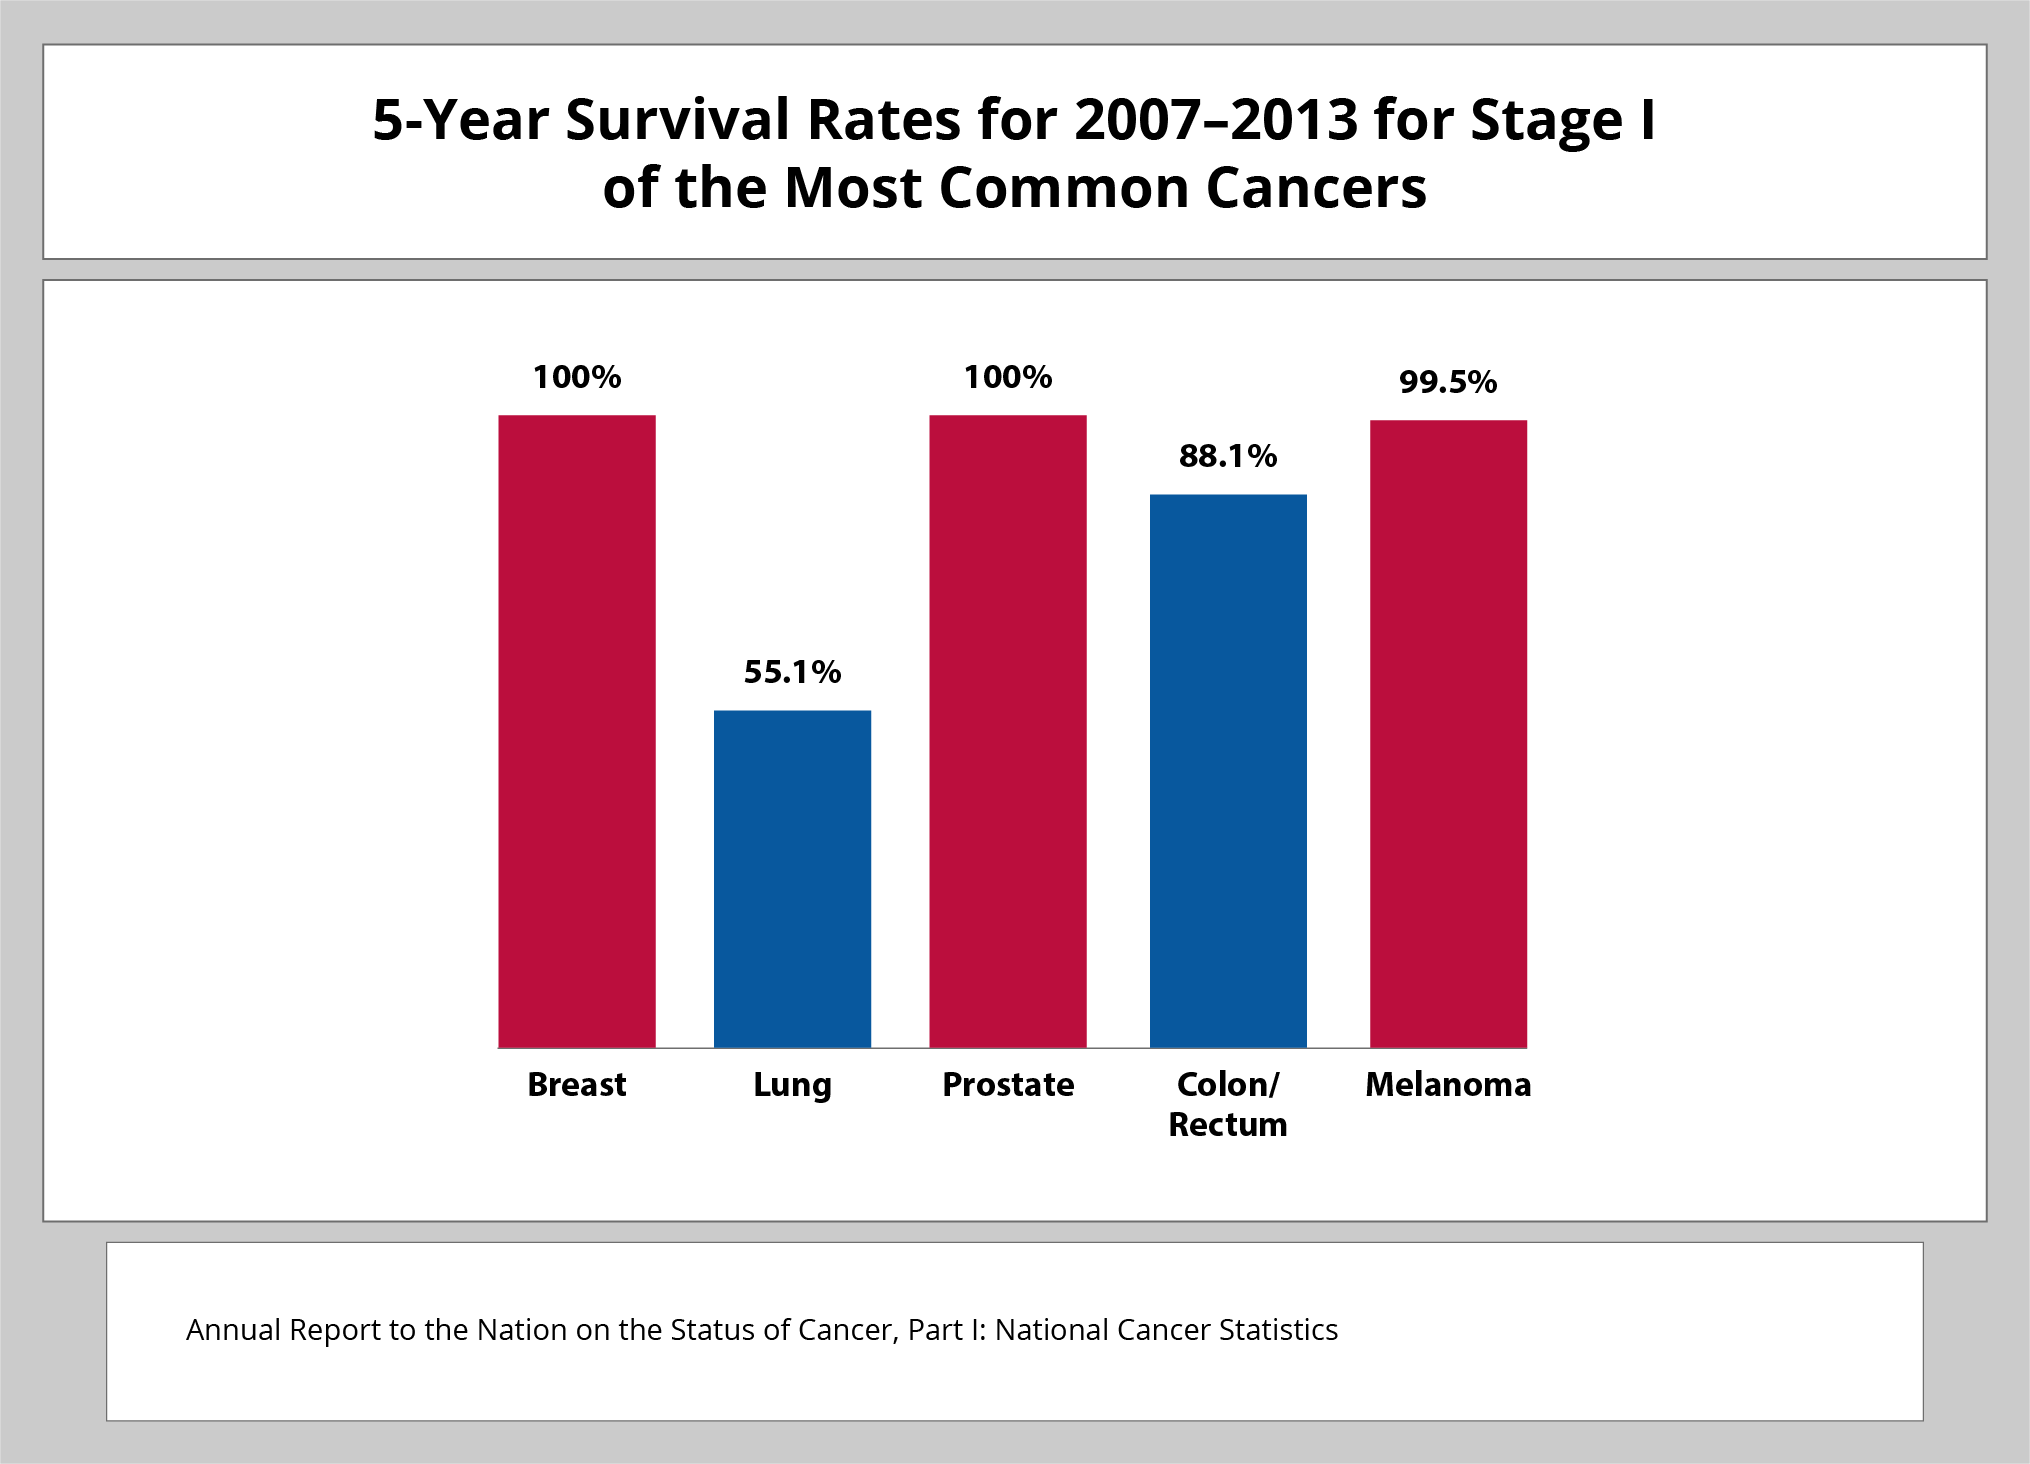
5-Year Survivial Rates for 2007-2013 for Stage 1 of the Most Common Cancers

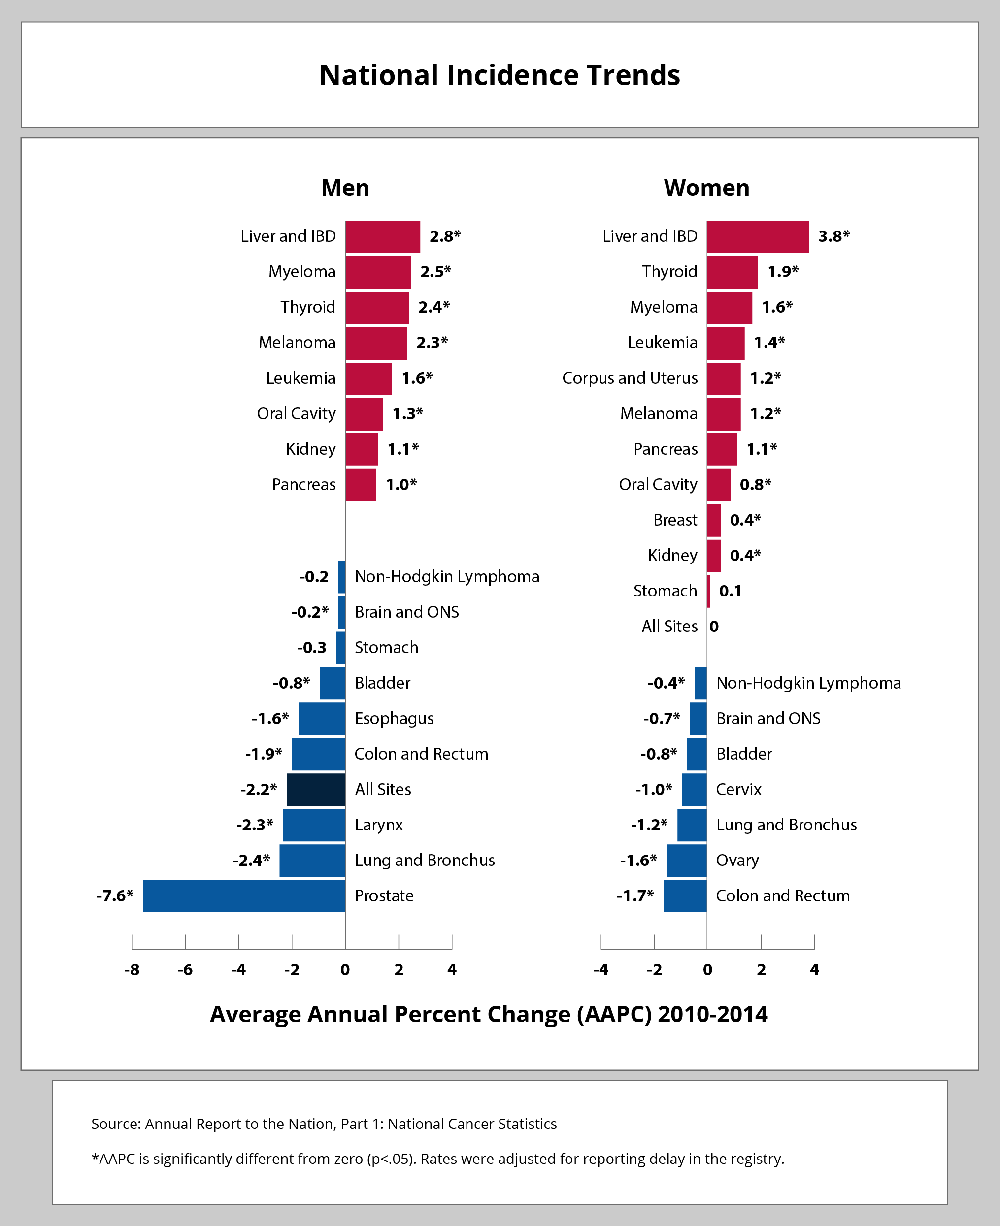
National Incidence Trends

Average Annual Percent Change (AAPC) 2010-2014

Colorectal Test Use Rates for Adults Aged 50-75 Years, Both Sexes, 2000-2015
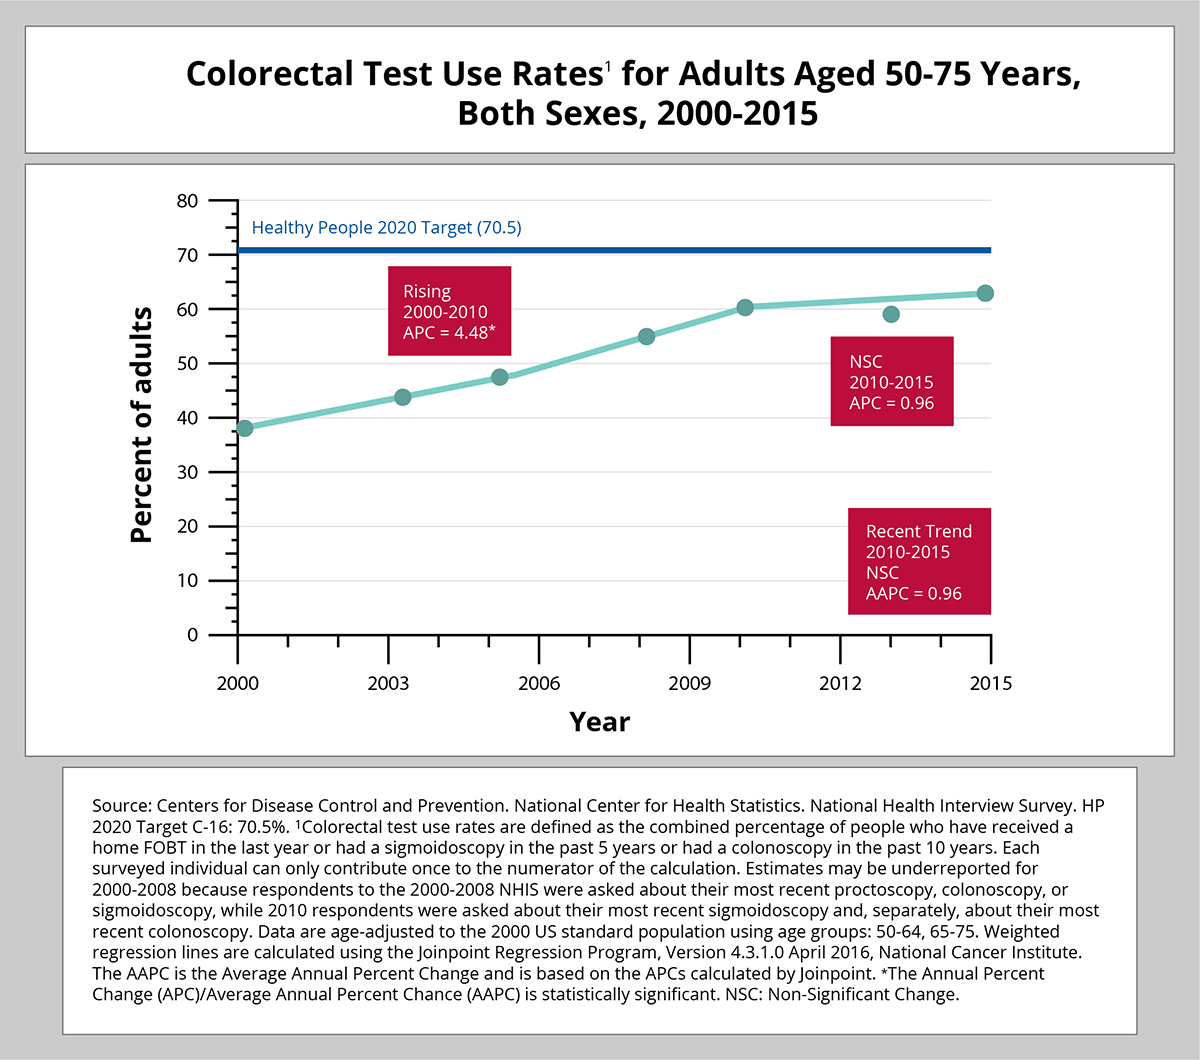
Source: Centers for Disease Control and Prevention. National Center for Health Statistics. National Health Interview Survey. HP 2020 Target C-16: 70.5%. 1Colorectal test use rates are defined as the combined percentage of people who have received a home FOBT in the last year or had a sigmoidoscopy in the past 5 years or had a colonoscopy in the past 10 years. Each surveyed individual can only contribute once to the numerator of the calculation. Estimates may be underreported for 2000-2008 because respondents to the 2000-2008 NHIS were asked about their most recent proctoscopy, colonoscopy, or sigmoidoscopy, while 2010 respondents were asked about their most recent sigmoidoscopy and, separately, about their most recent colonoscopy. Data are age-adjusted to the 2000 US standard population using age groups: 50-64, 65-75. Weighted regression lines are calculated using the Join point Regression Program, Version 4.3.1.0 April 2016, National Cancer Institute. The AAPC is the Average Annual Percent Change and is based on the APCs ca lcu lated by Join point. *The Annual Percent Change (APC)/Average Annual Percent Chance (AAPC) is statistica lly significant. NSC: Non-Significant Change.

Smoke-free Air Law Coverage By State (2017)
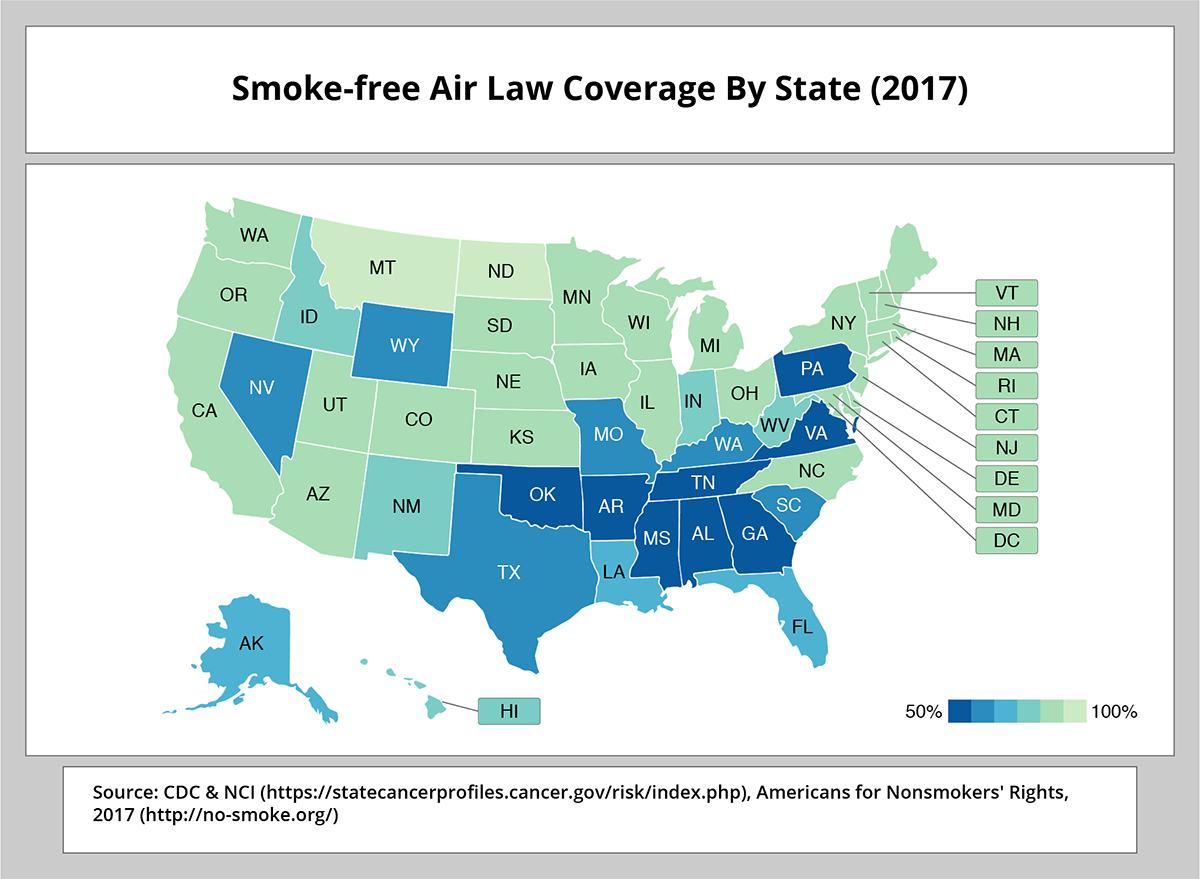
Smoke-free Air Law Coverage By State (2017). Source: CDC & NCI (https://statecancerprofiles.cancer.gov/risk/index.php), Americans for Nonsmokers’ Rights, 2017 (https://no-smoke.org/)

Cervical Cancer Trends: New Cases & Death Rates, 1992-2014
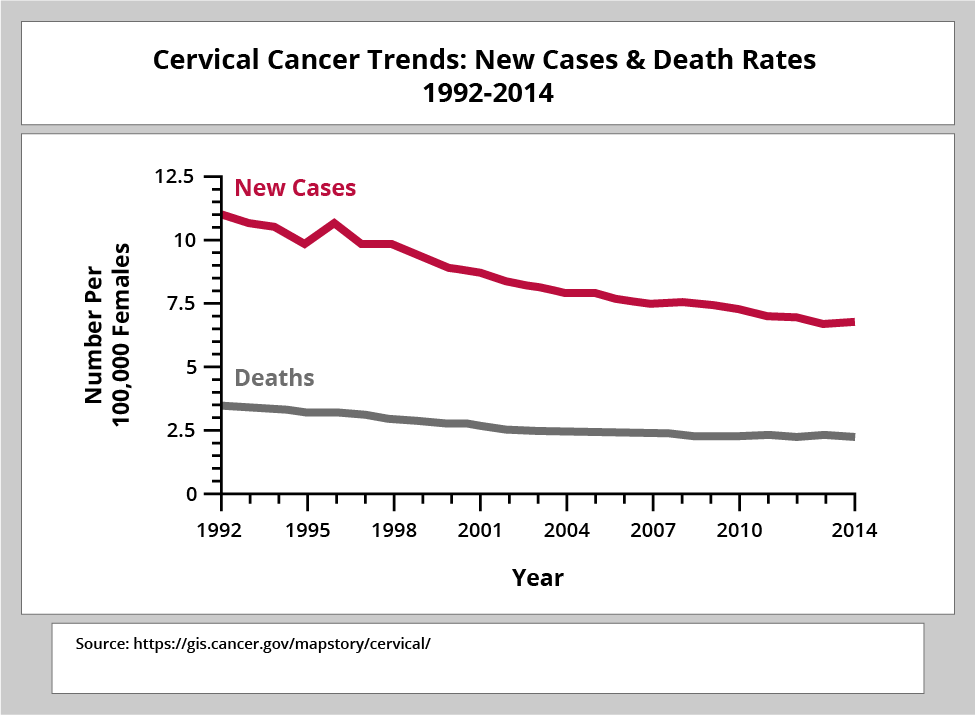
Cervical Cancer Trends: New Cases & Death Rates, 1992-2014. Source: https://seer.cancer.gov/statfacts/html/cervix.html

Monograph 22: A Socioecological Approach to Addressing Tobacco-Related Health Disparities
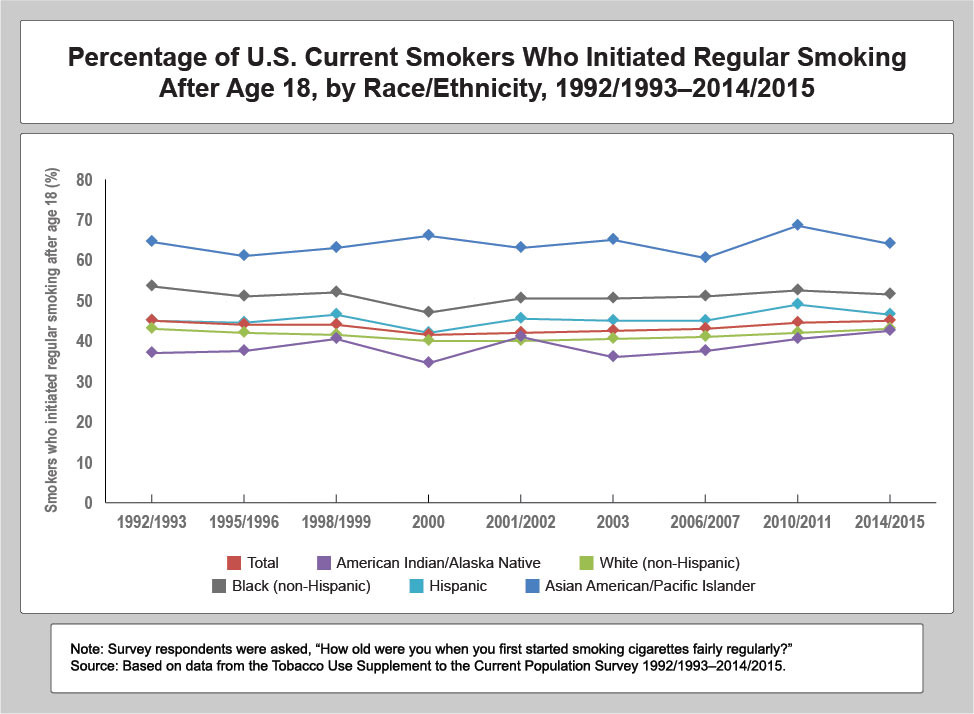
Percentage of US Current Smokers Who Initiated Regular Smokign After Age 18, by Race/Ethnicity, 1992/1993-2014/2015.

Patient-Provider Discussions About Lung Cancer Screening Remain Infrequent
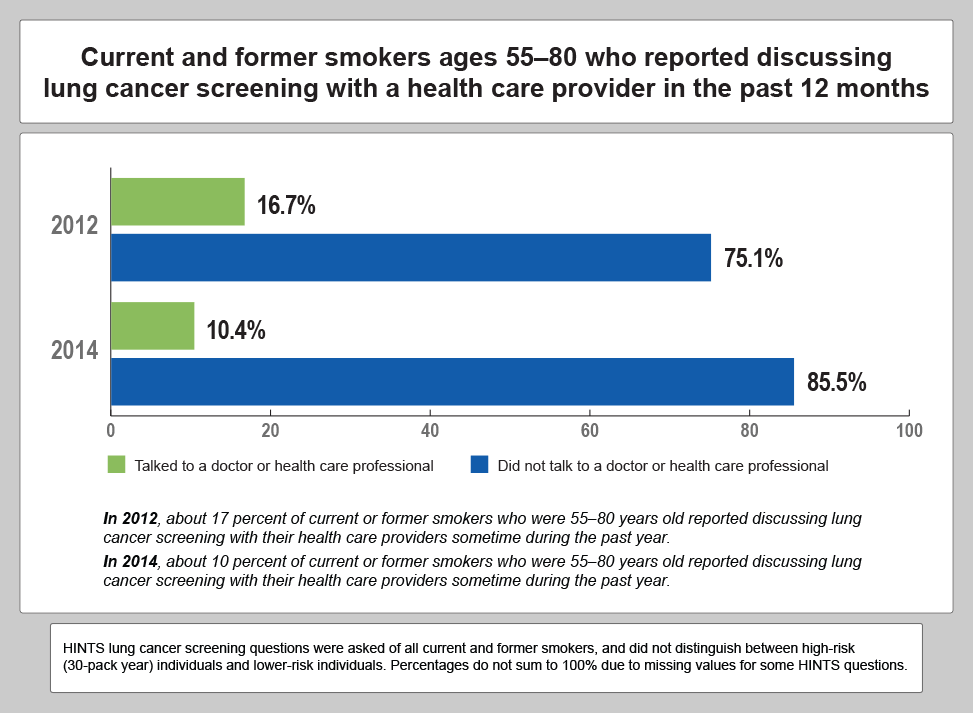
In 2012, about 17 percent of current or former smokers who were 55-80 years old reported discussing lung cancer screenign with their health care providers sometime during the past year. In 2014, about 10 percent of current or former smokers who were 55-80 years old reported discussing lung cancer screenign with their health care providers sometime during the past year.

Annual Report to the Nation on the Status of Cancer, 1975-2014, Featuring Survival
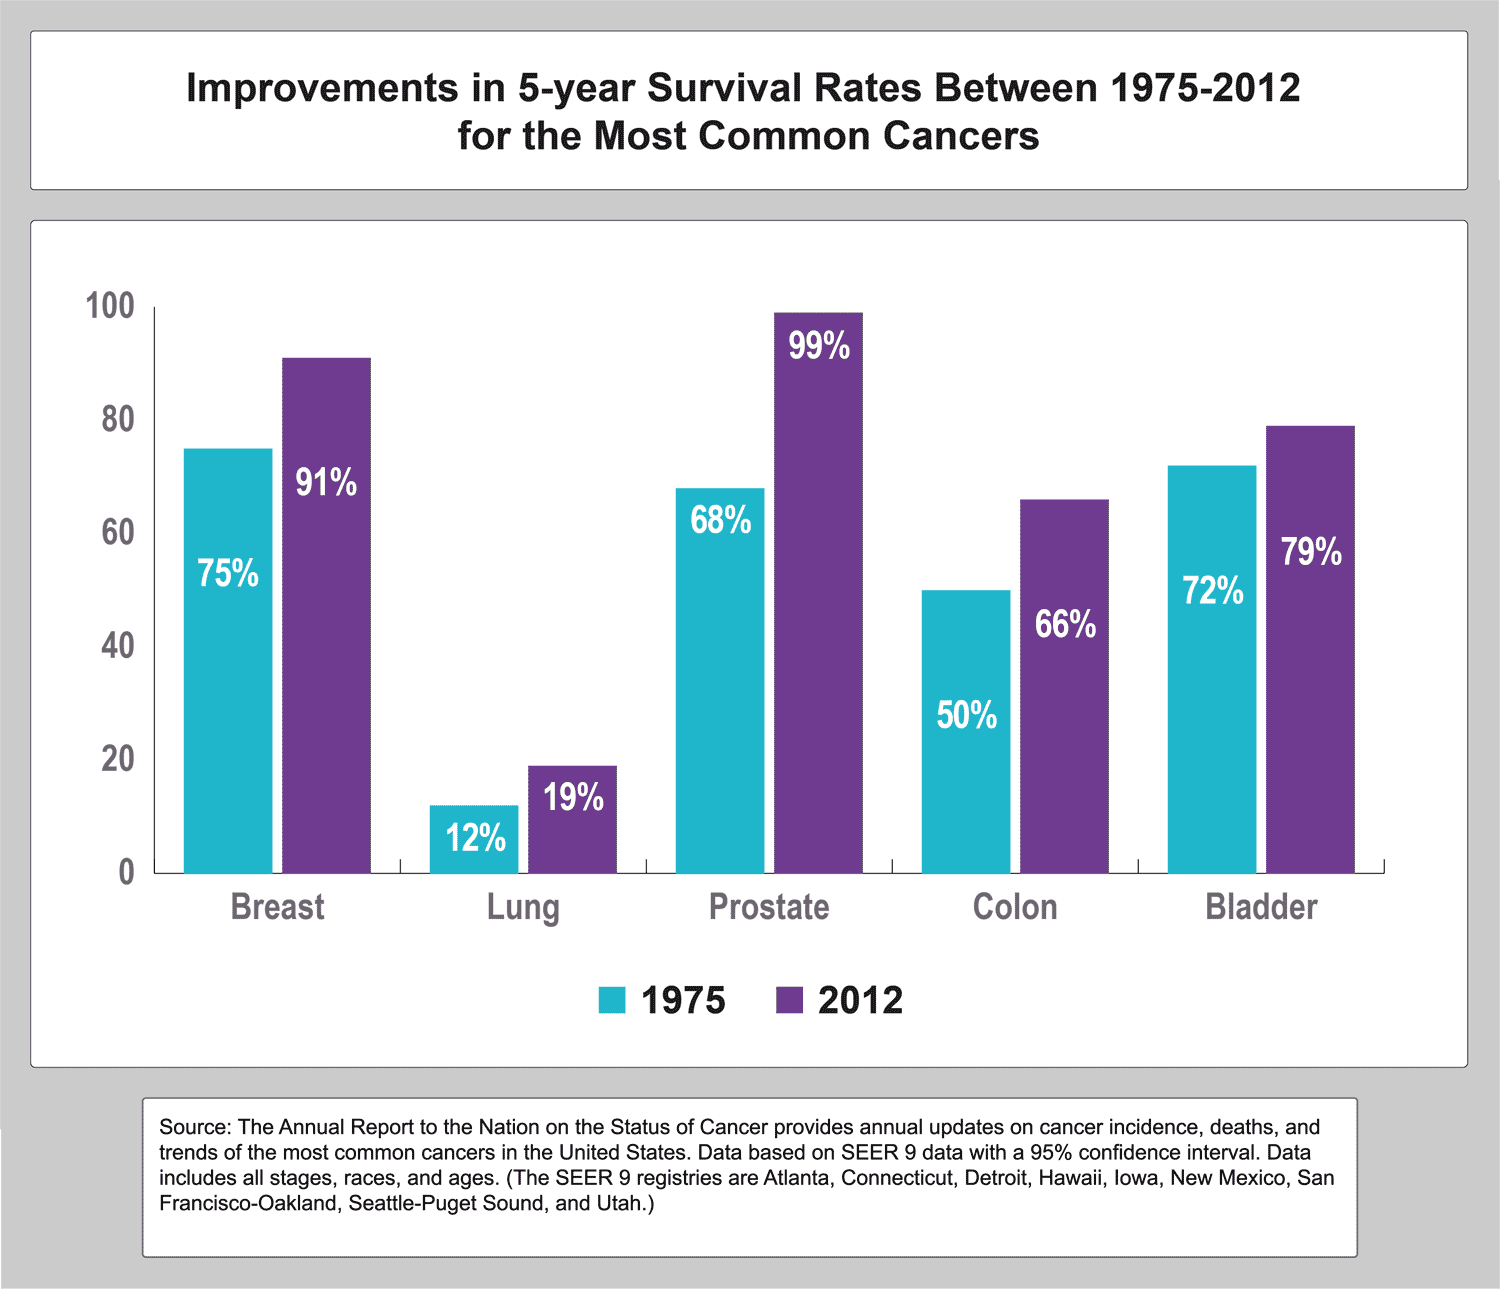
Improvements in 5-year Survival Rates Between 1975-2012 for the Most Common Cancers. Source: The Annual Report to the Nation on the Status of Cancer provides annual updates on cancer incidence, deaths, and trends of the most common cancers in the United States. Data based on SEER 9 data with a 95% confidence inverval. Data includes all stages, race and ages.

Cancer Trends Progress Report: Physical Activity Trends
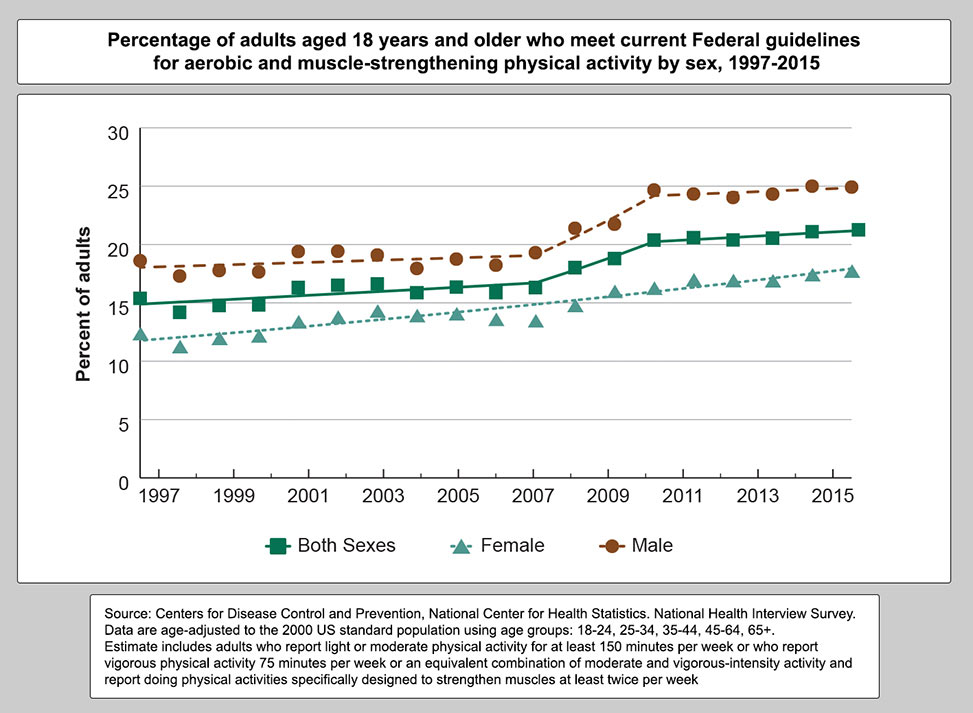
Percentage of adults aged 18 years and older who meet current Federal guidelines for aerobic and muscle-strengthening physical activity by sex, 1997-2015

Age-Adjusted Incident Rates by State (2009 to 2013) Lung Cancer
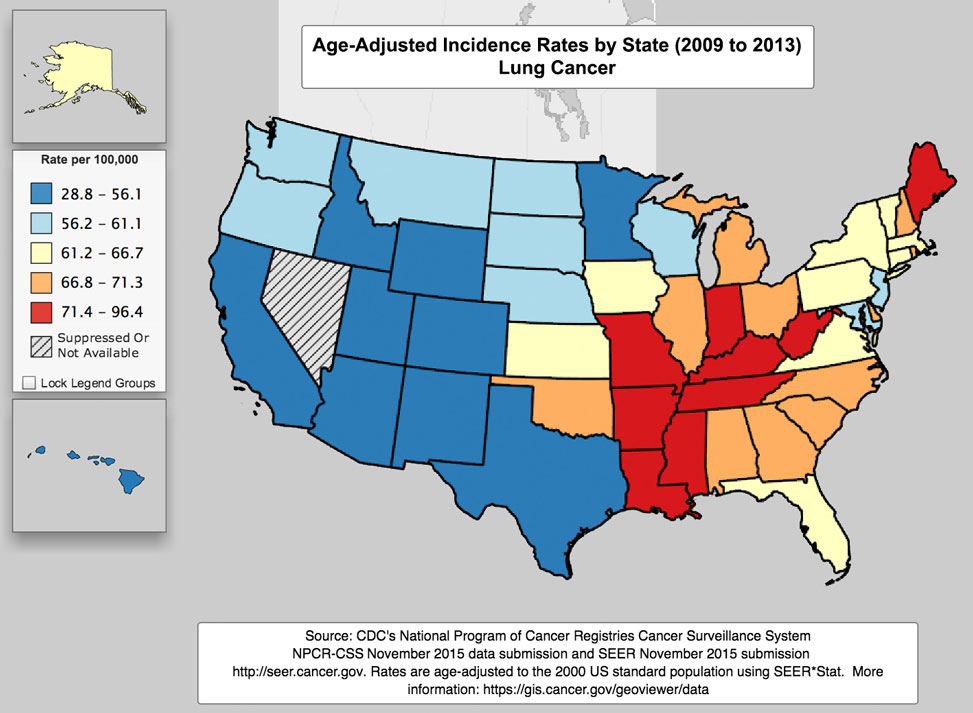
Age-Adjusted Incident Rates by State (2009 to 2013) Lung Cancer

Estimated Number of Cancer Survivors in the U.S., by Site
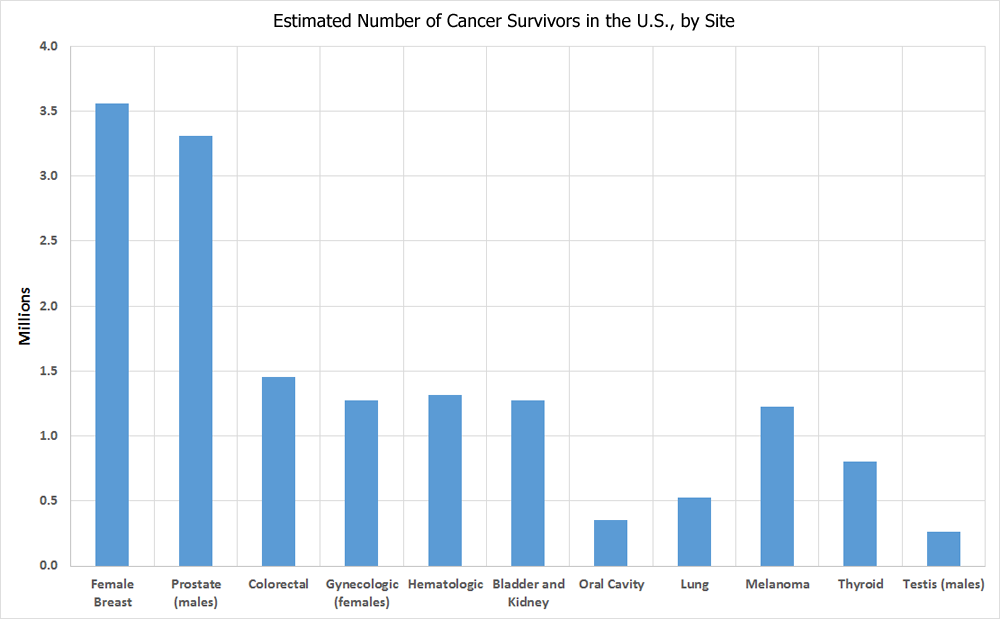
Estimated Number of Persons Alive in the U.S. Who Were Diagnosed With Cancer, by Site

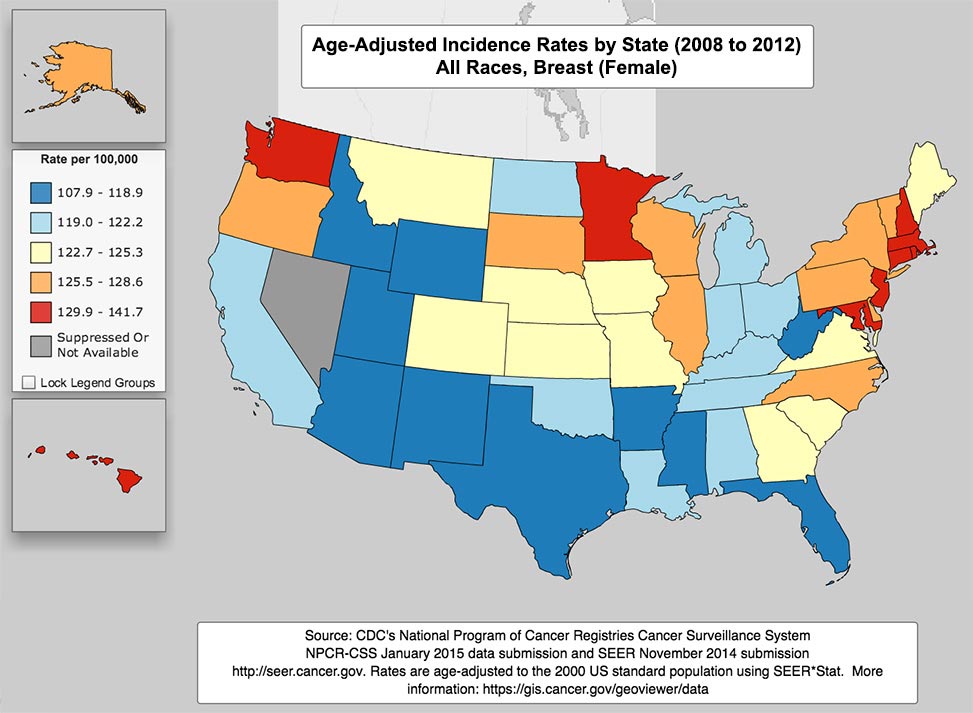
Female Breast Cancer Incidence

Female Breast Cancer Incidence

Number of New Cancer Cases & Deaths Each Year
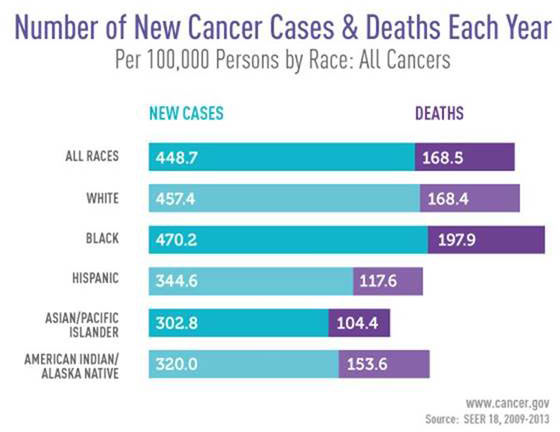
Number of New Cancer Cases and Deaths Each Year

Estimated Cancer Prevalence by Age in the US Population from 1975 to 2040
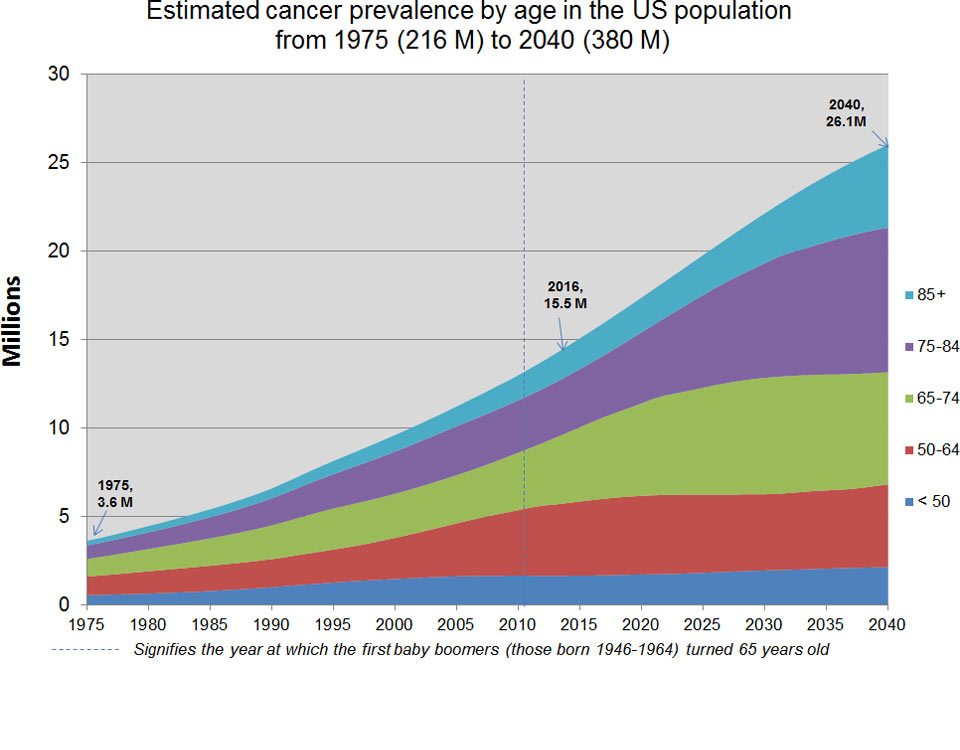
Estimated Cancer Prevalence by Age in the US Population from 1975 to 2040

SEER Cancer Statistics Review (CSR) 1975-2013
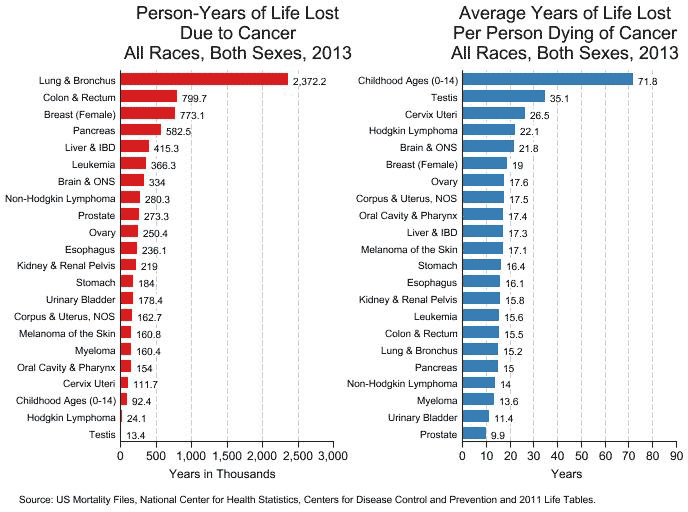
CSR Figure 1.19: Person and Average Years of Life Lost by Cancer Site

The Annual Report to the Nation on the Status of Cancer: Incidence Rates for Liver Cancer by Race/Ethnicity During 2008-2012
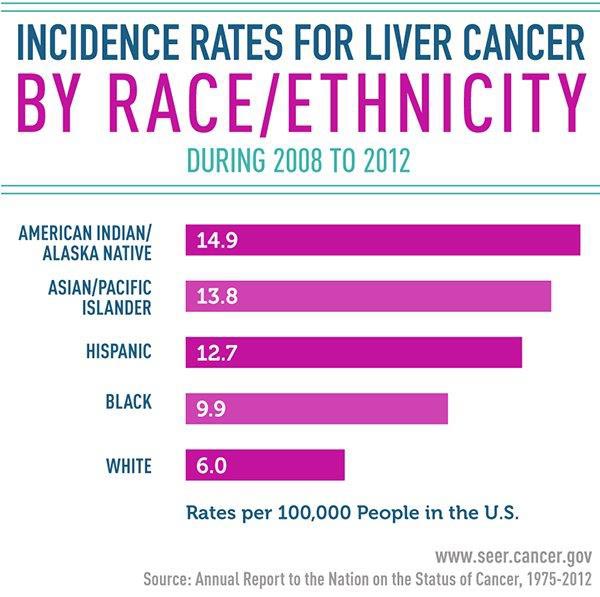
The Annual Report to the Nation on the Status of Cancer: Incidence Rates for Liver Cancer by Race/Ethnicity During 2008-2012

The Annual Report to the Nation on the Status of Cancer: Long-term mortality trends, based on AAPC, 2003-2012
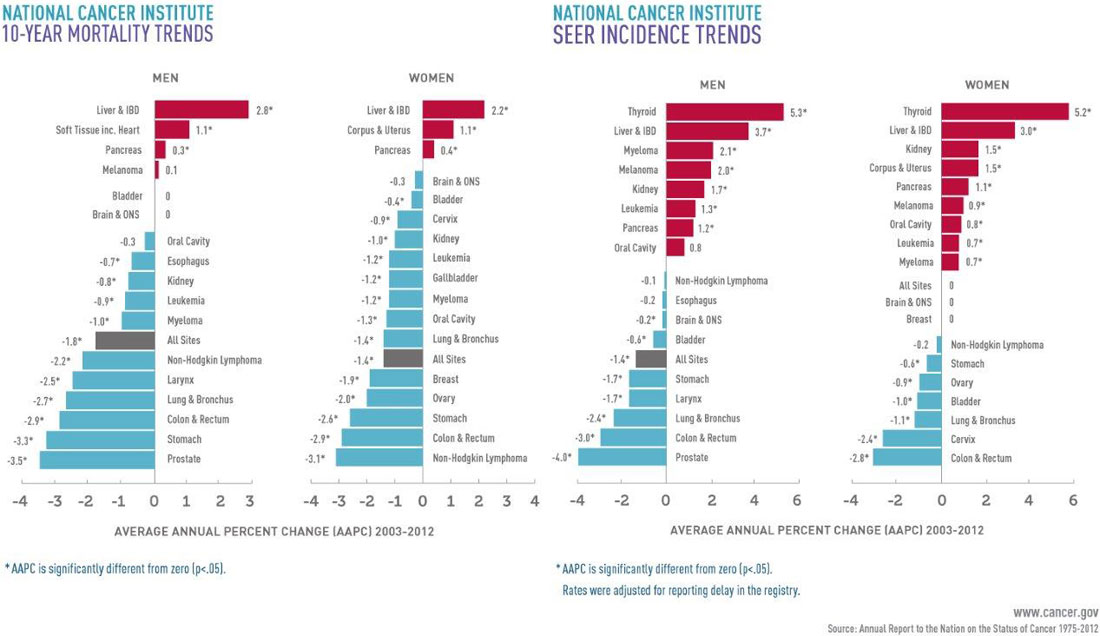
The Annual Report to the Nation on the Status of Cancer: Long-term mortality trends, based on AAPC, 2003-2012

Monitoring a Changing Health Information Environment
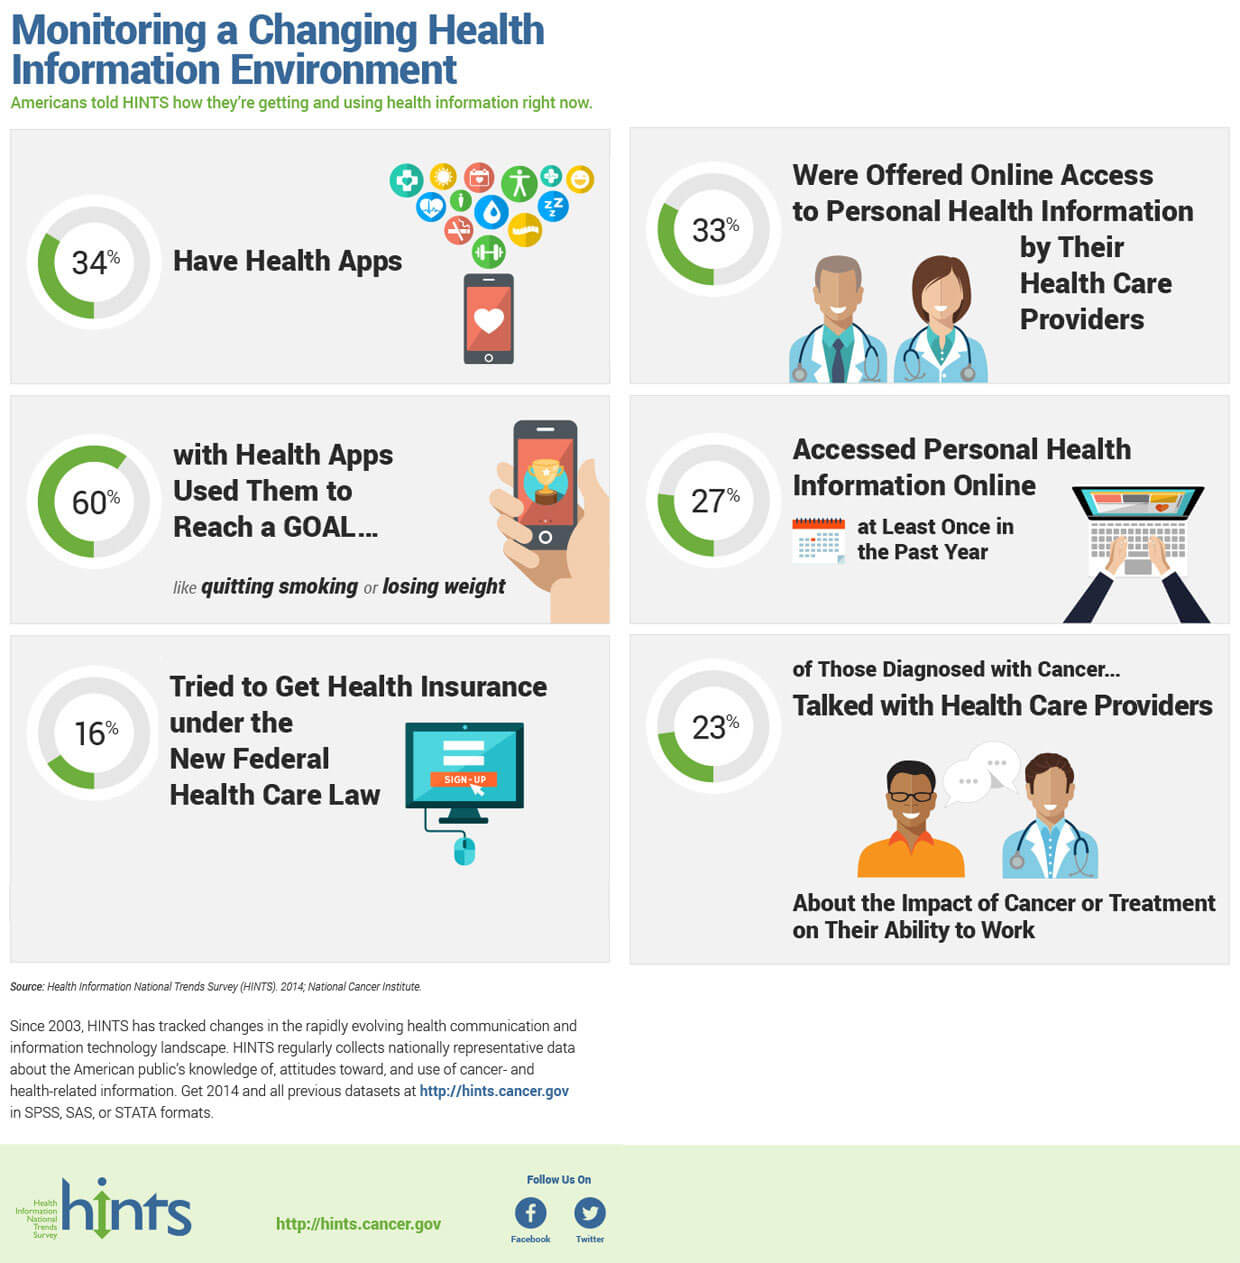
This illustration is included in the National Cancer Institute's Annual Plan & Budget Proposal for Fiscal Year 2017.

Up for a Challenge? Stimulating Innovation in Breast Cancer Genetic Epidemiology
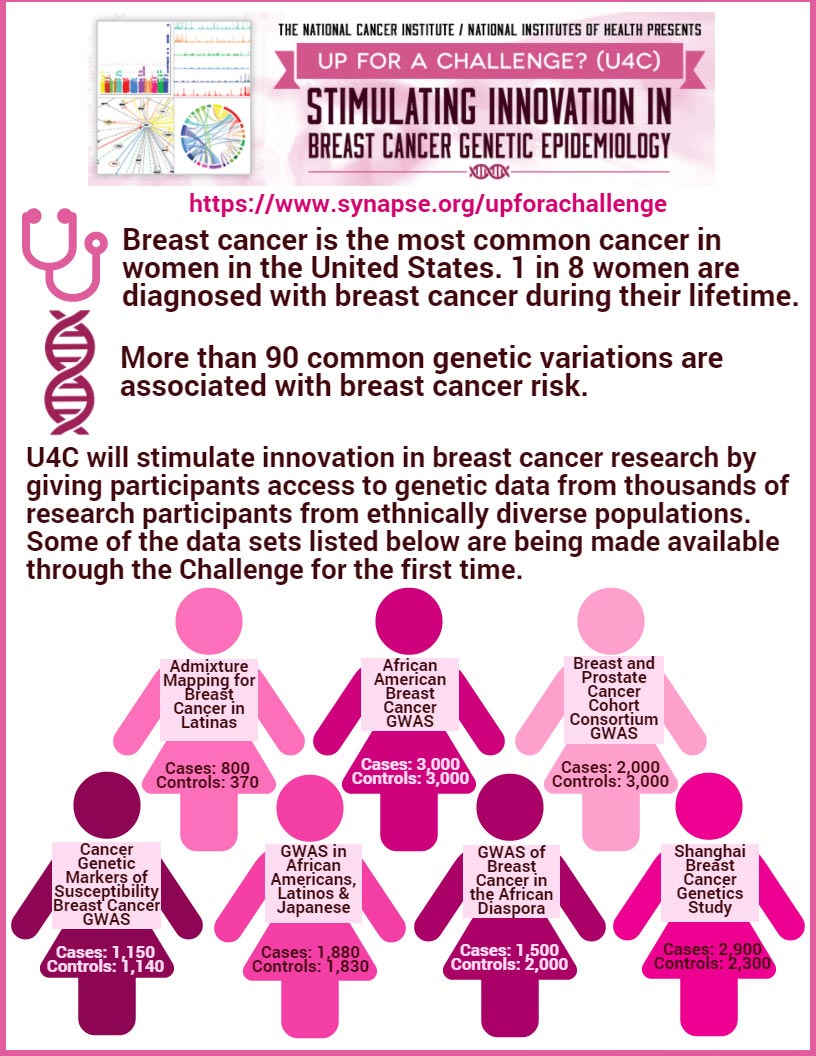
This illustration is included in the National Cancer Institute's Annual Plan & Budget Proposal for Fiscal Year 2017.

From NCI’s Annual Plan & Budget Proposal for Fiscal Year 2017
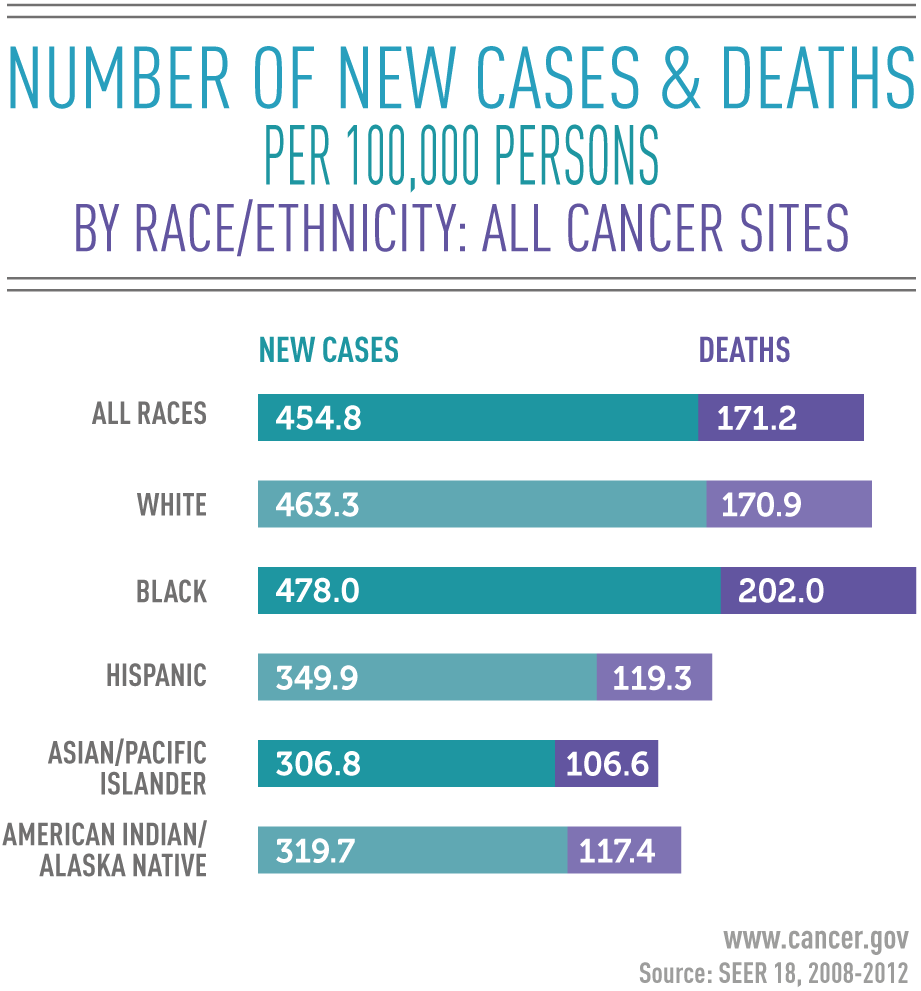
This illustration is included in the National Cancer Institute's Annual Plan & Budget Proposal for Fiscal Year 2017.

March 2015. Colorectal Cancer Incidence Rates 2007-2011
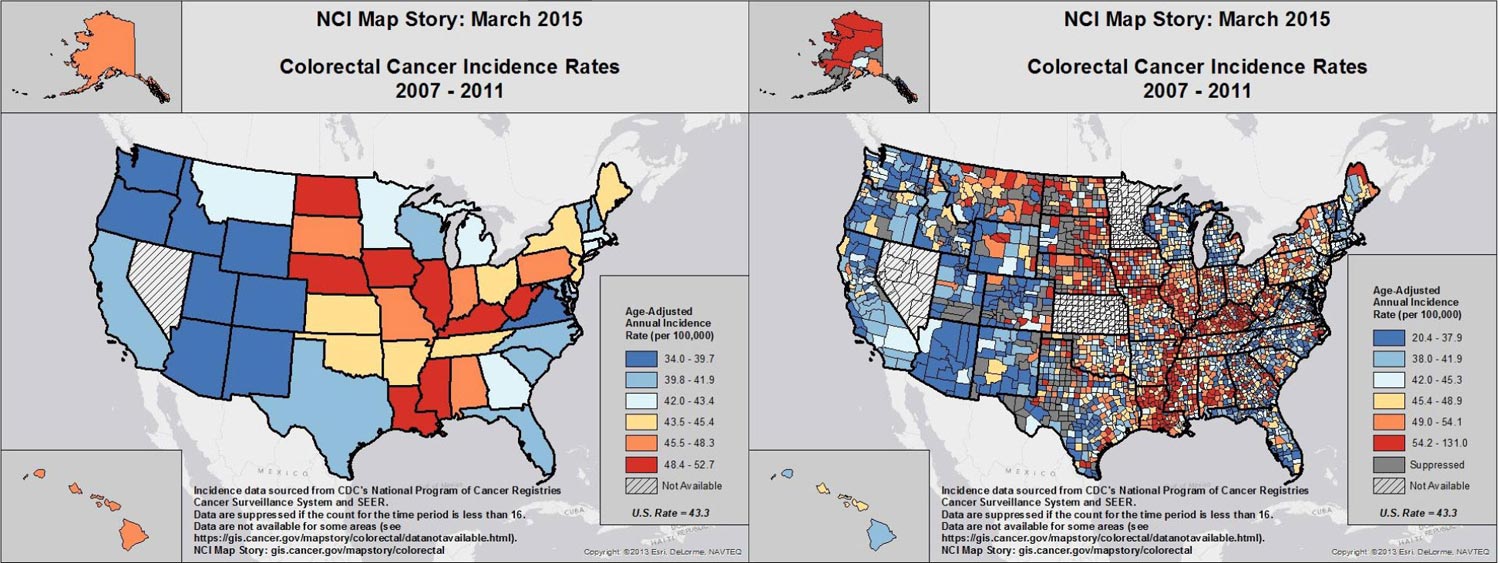
NCI Map Story: March 2015. Colorectal Cancer Incidence Rates 2007-2011

March 2015. Colorectal Cancer Screening Rates 2012
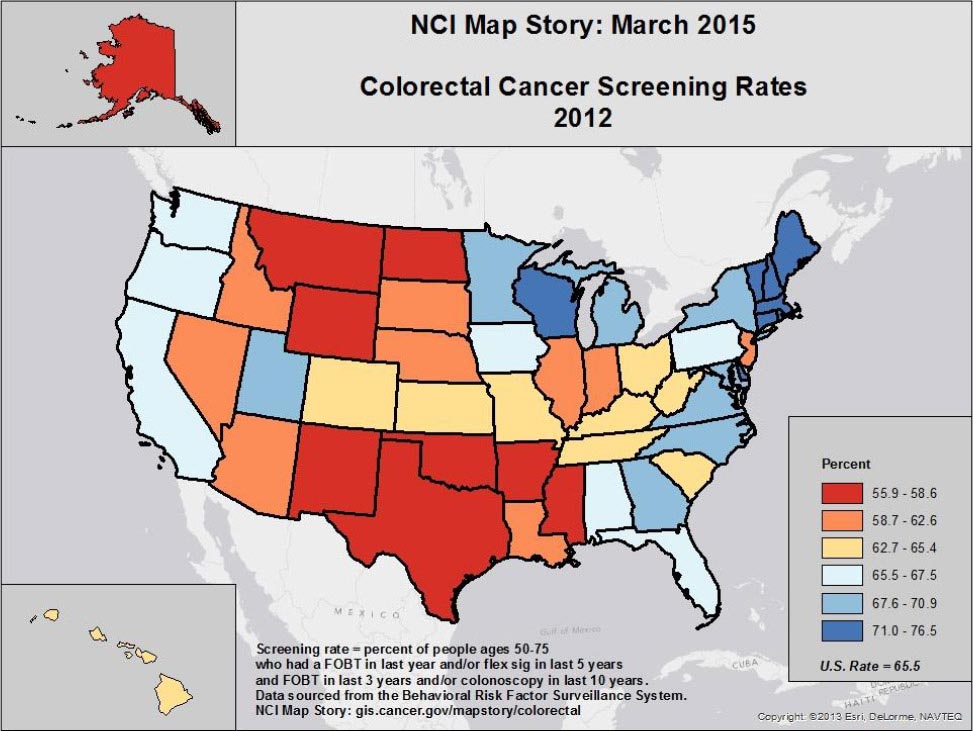
NCI Map Story: March 2015. Colorectal Cancer Screening Rates 2012

Annual Report to the Nation on the Status of Cancer, 1975-2011
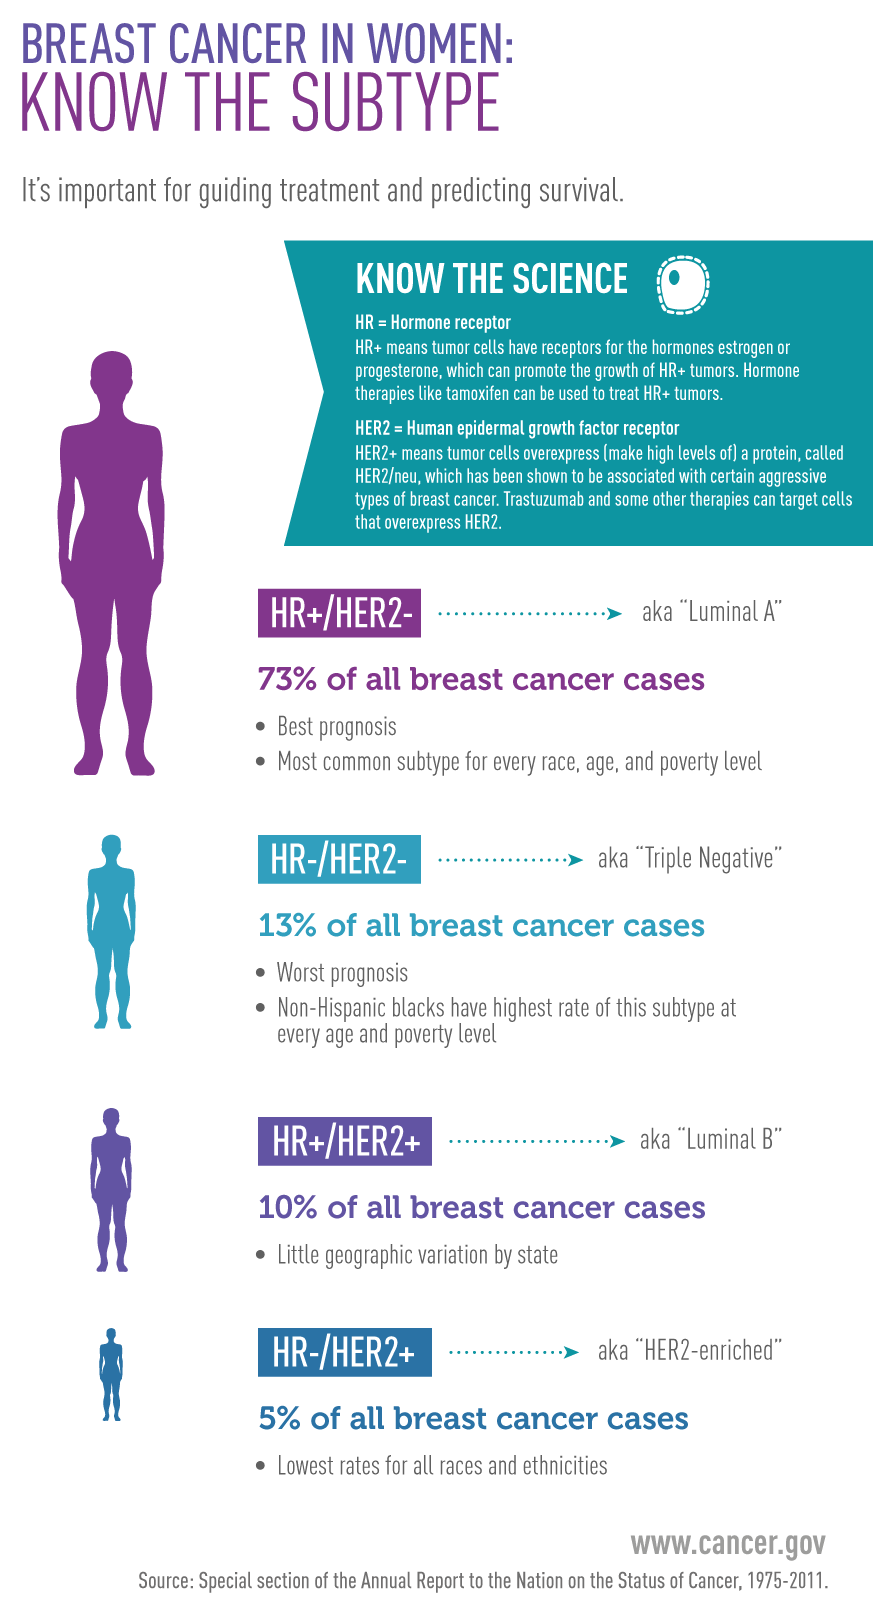
The Annual Report to the Nation on the Status of Cancer, 1975-2011, is an update of rates for new cases, deaths and trends for the most common cancers in the United States. All rates in the report are per 100,000 people in the U.S. population.

The Annual Report to the Nation on the Status of Cancer: Long-term mortality trends, based on AAPC, 2001-2011
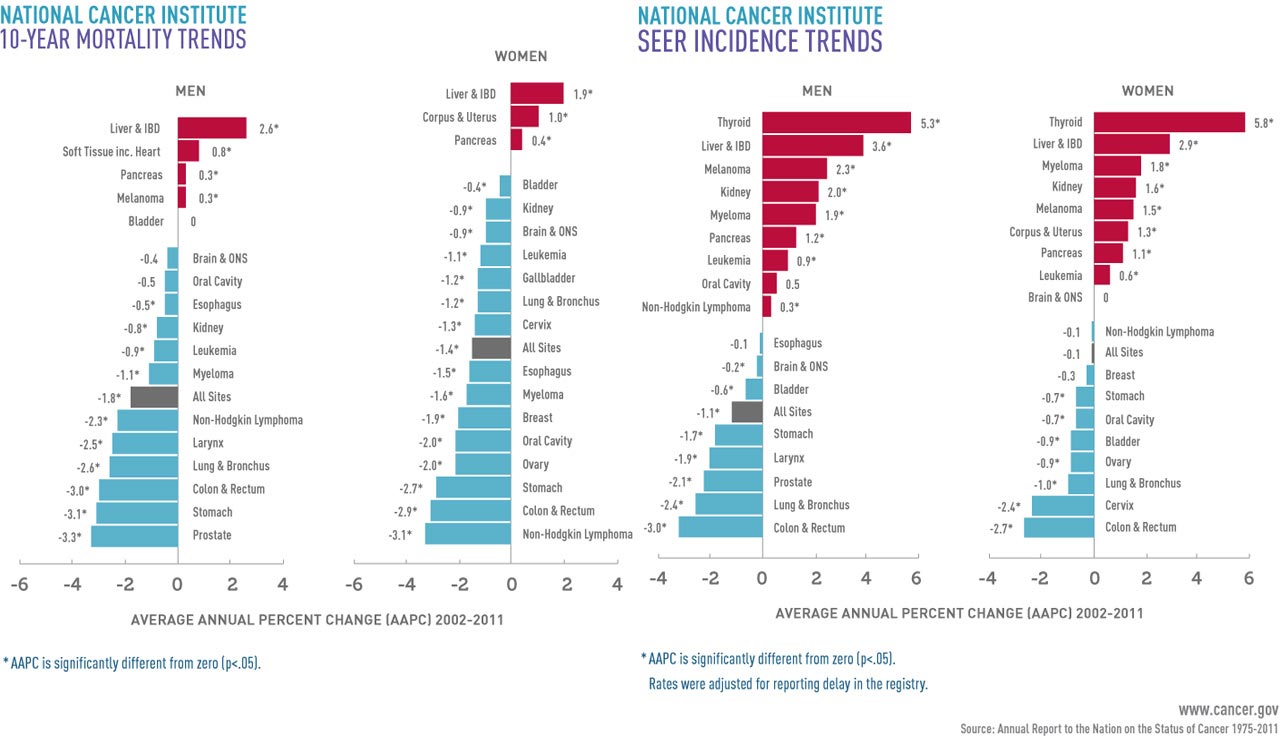
Long-term mortality trends, based on AAPC, 2001-2011

March 19, 2015: Percent of females aged 9-26 years who had received at least one dose of the HPV immunization by age, 2008-2010
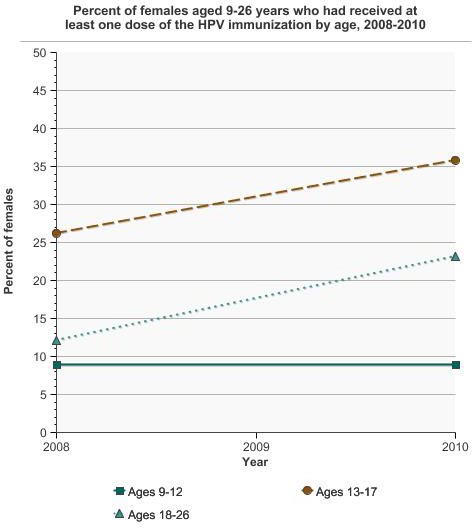
Percent of females aged 9-26 years who had recieved at least one dose of the HPV immunization by age, 2008-2010

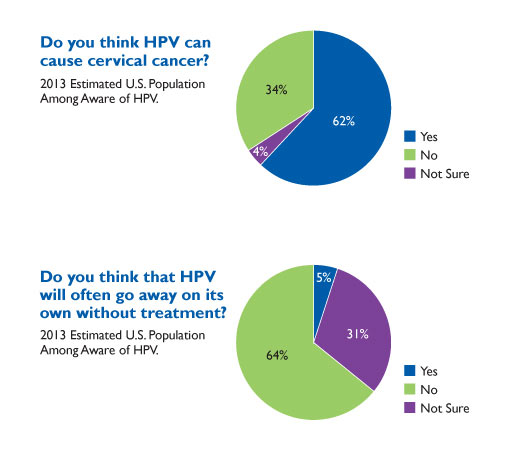
December 9, 2014: Preventing Cancer through Increased Human Papillomavirus (HPV) Vaccine Uptake
National Expenditures for Cancer Care Projected to Increase by at Least 27% Between 2010 to 2020 Because of Aging and Growing Population

September 18, 2014: Cancer Prevalence and Cost of Care Projections
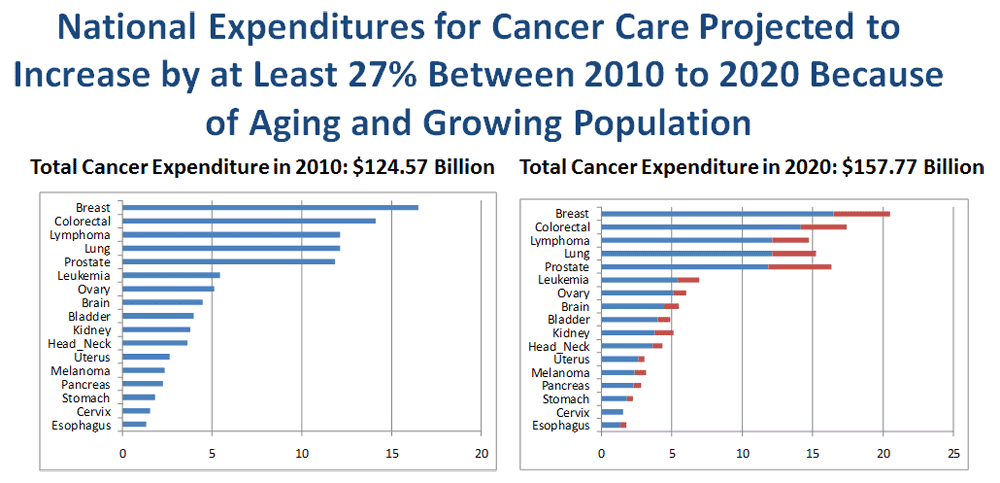
National Expenditures for Cancer Care Projected to Increase by at Least 27% Between 2010 to 2020 Because of Aging and Growing Population

September 2, 2014: Smoothed age-adjusted death rates over time for colorectal cancer, using the Animated Historical Cancer tool.
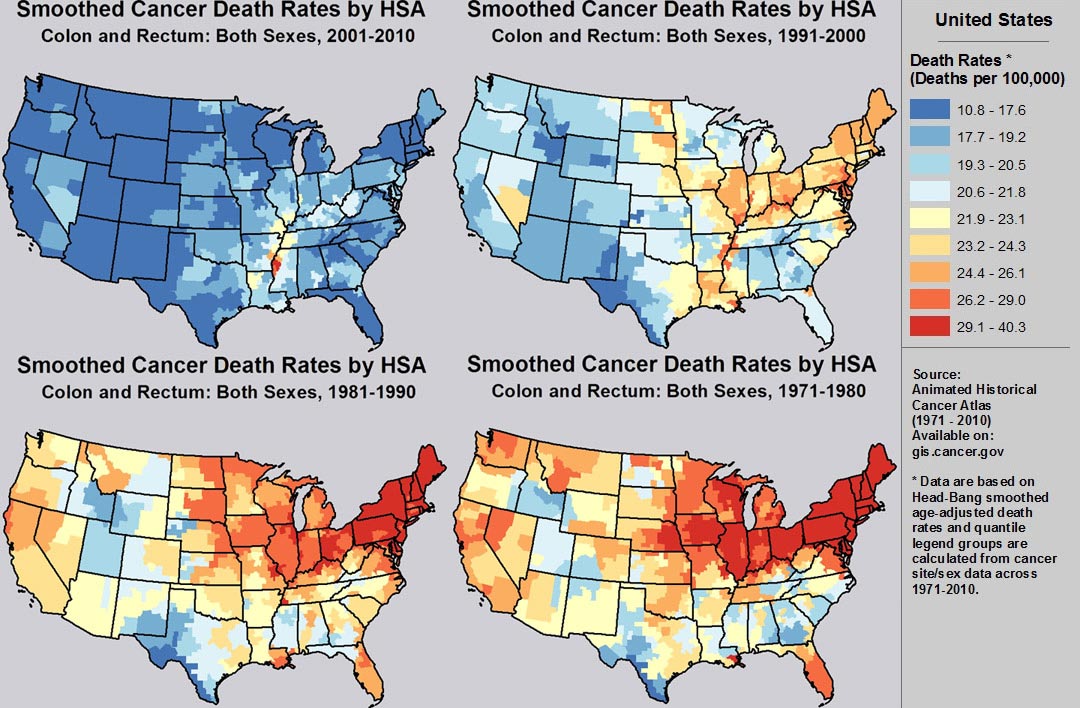
Smoothed age-adjusted death rates over time for colorectal cancer, using the Animated Historical Cancer tool

August 8, 2014: Breast Cancer Genomic Tests Application Type
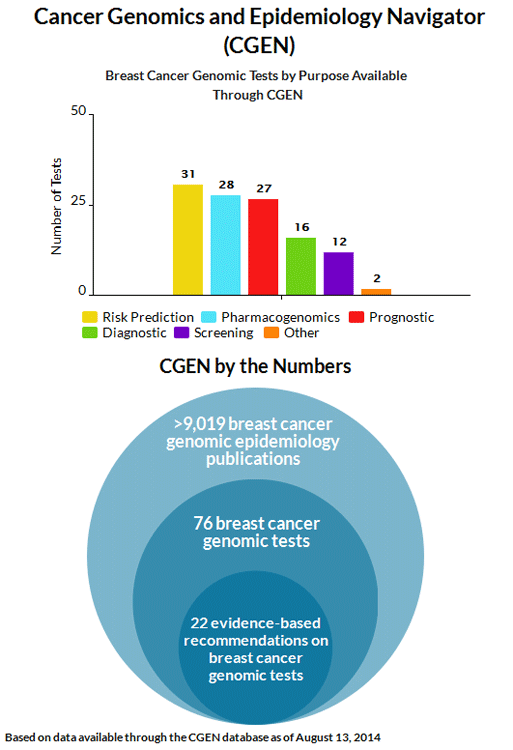
Breast Cancer Genomic Tests Application Type

July 17, 2014: Policy Environment for Physical Education by State: Classification of Laws Associated with School Students (CLASS).
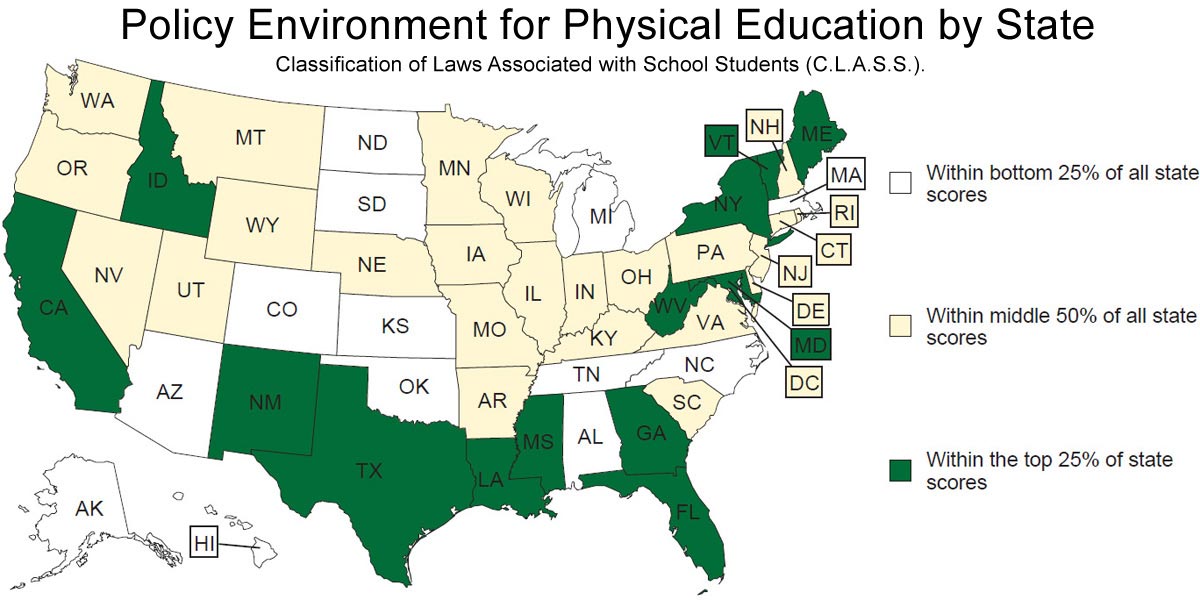
This index combines CLASS scores  across grade levels and policy areas

June 19, 2014: United States Average Global Solar Radiation / Percent of People Who Rarely or Never Wear Sunscreen When Outside On A Warm, Sunny Day
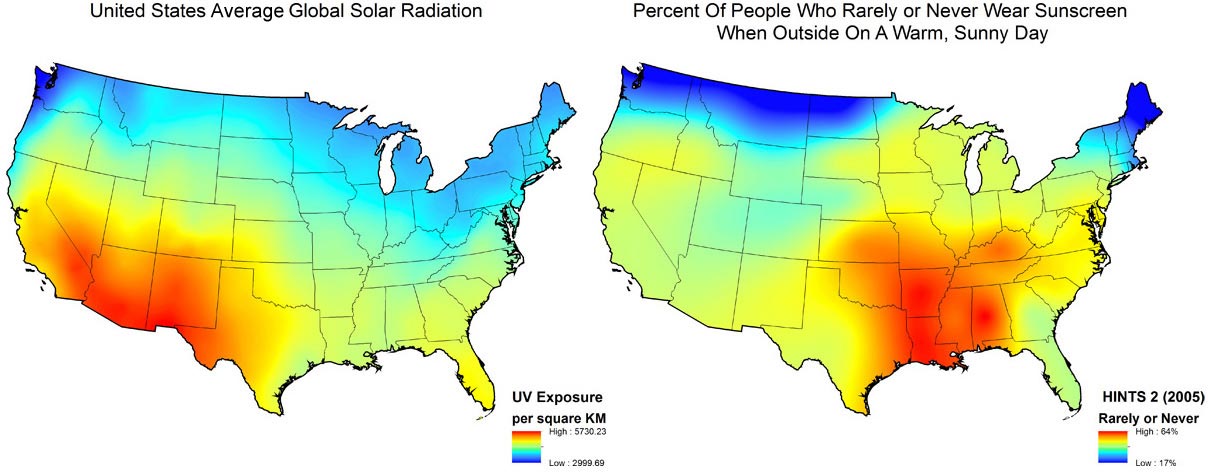
United States Average Global Solar Radiation / Percent of People Who Rarely or Never Wear Sunscreen When Outside On A Warm, Sunny Day

June 1, 2014: Estimated and Project Number Estimated and projected number of cancer survivors in the United States from 1977-2022 by years since diagnosis May 7, 2014 The NCI Director referred to this DCCPS graphic on aging and cancer in his testimony to the U.S. Senate on May 7, 2014
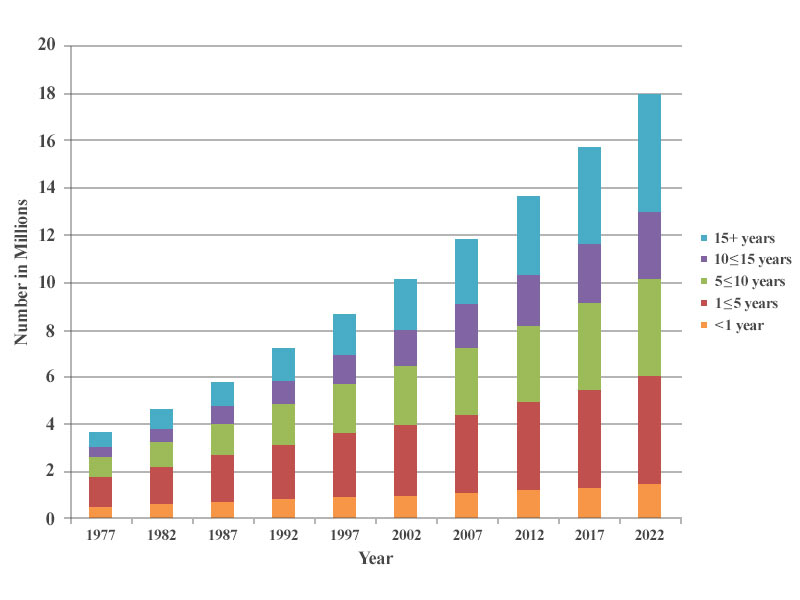
Estimated and Project Number Estimated and projected number of cancer survivors in the United States from 1977-2022 by years since diagnosis May 7, 2014 The NCI Director referred to this DCCPS graphic on aging and cancer in his testimony to the U.S. Senate on May 7, 2014

May 7, 2014: The NCI Director referred to this DCCPS graphic on aging and cancer in his testimony to the U.S. Senate on May 7, 2014.
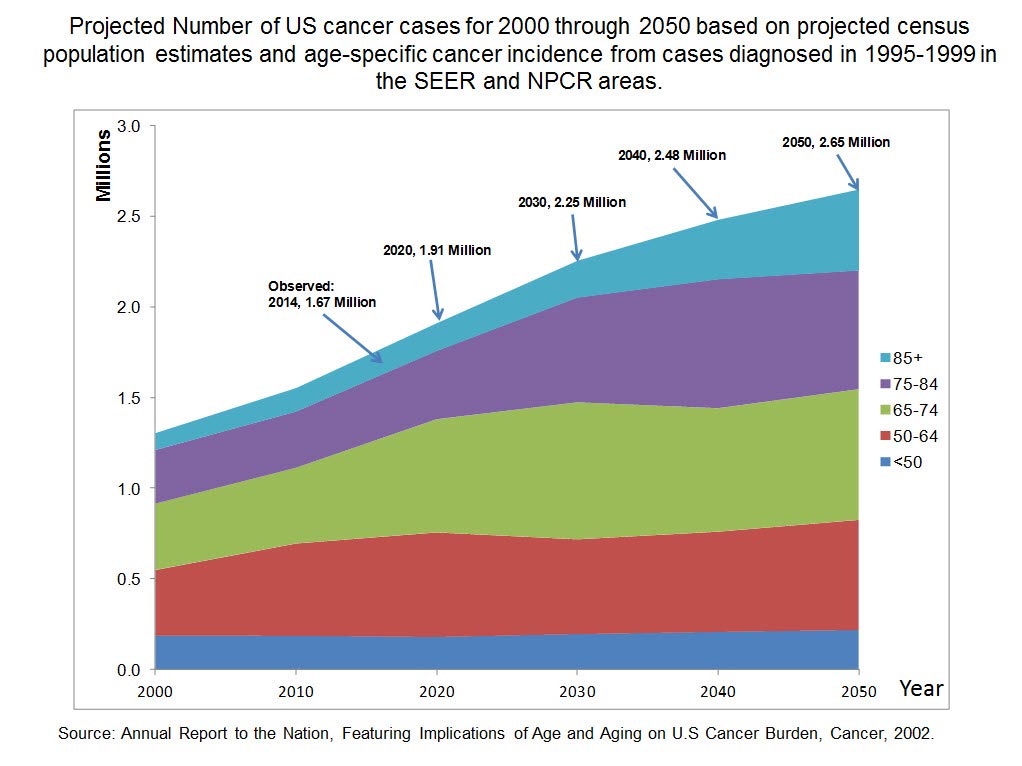
The NCI Director referred to this DCCPS graphic on aging and cancer in his testimony to the U.S. Senate on May 7, 2014
Last Updated
October 27, 2022