Individuals are considered survivors from the time of a cancer diagnosis through the rest of their life. On this page, find key survivorship-related statistics and graphs.
For additional cancer-related statistics, please visit NCI's Surveillance, Epidemiology, and End Results (SEER) Program.
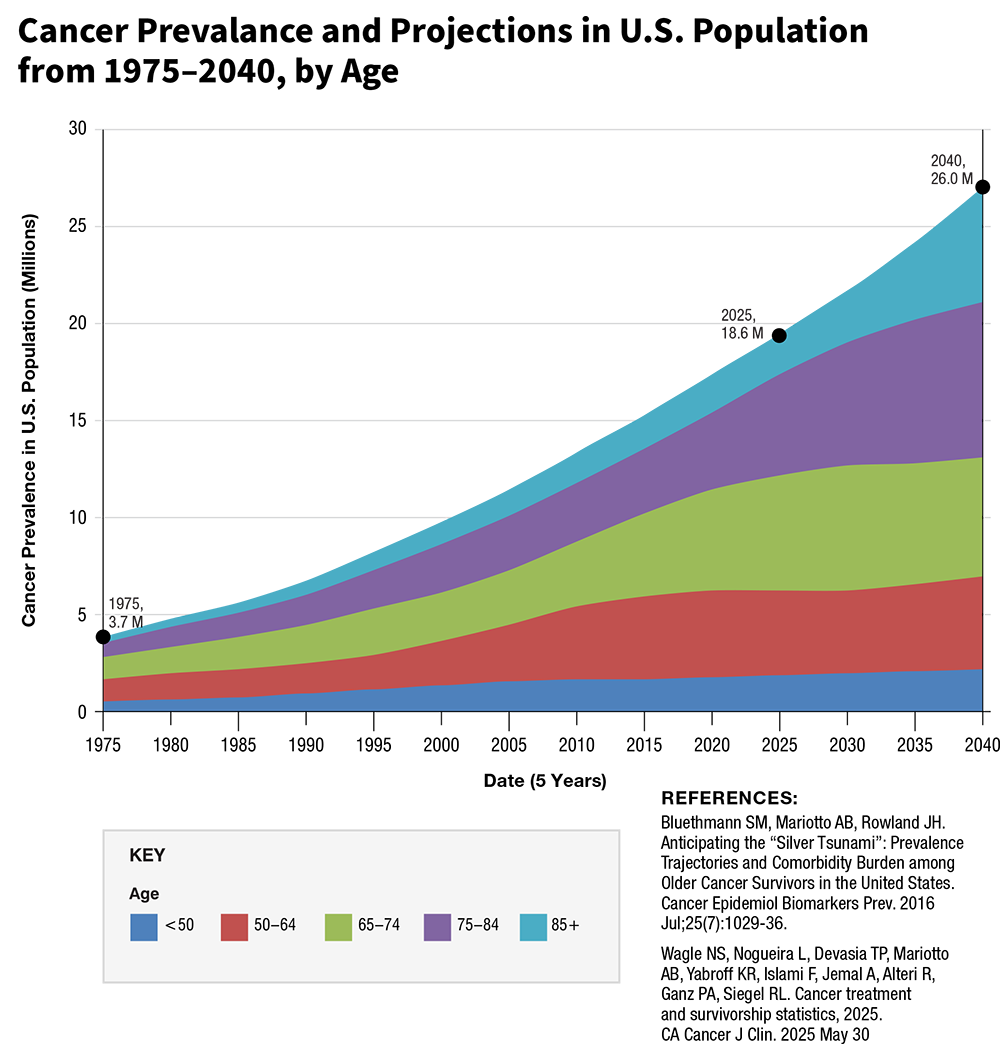
As of May 2025, it is estimated that there are 18.6 million cancer survivors in the United States. This represents approximately 5.4% of the population. 1
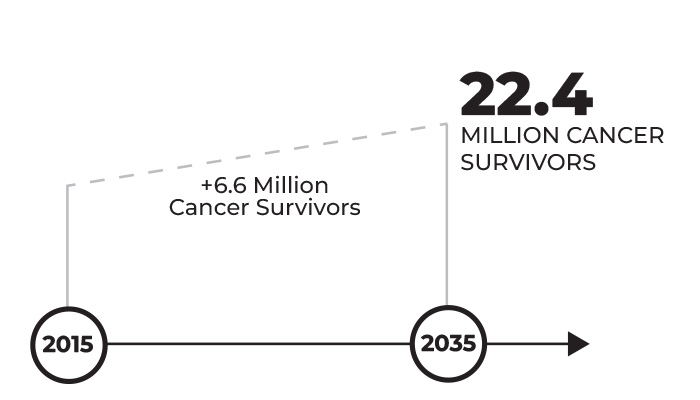
The number of cancer survivors in the United States is projected to grow to 22.4 million by 2035.1
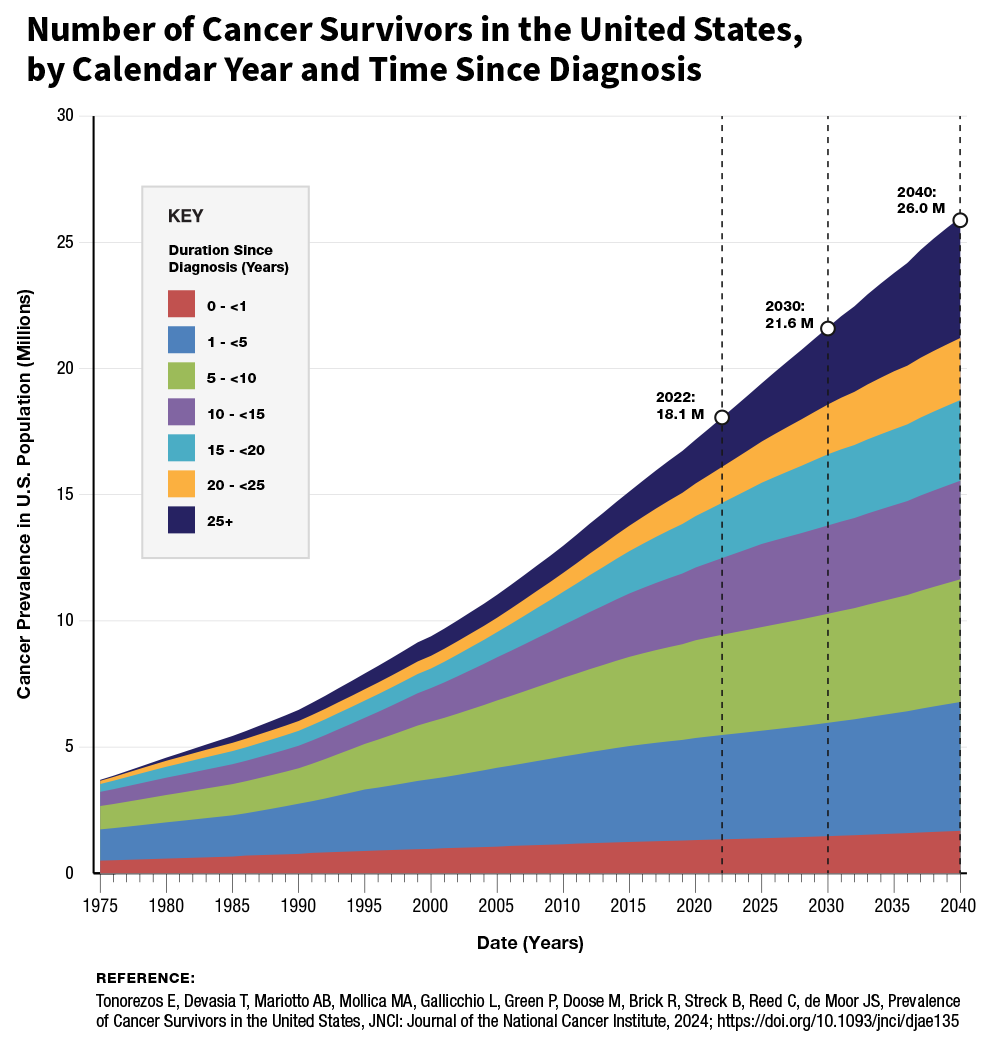
From 2022 to 2040, the number of people in the United States who have lived 5 or more years after their cancer diagnosis is projected to increase approximately 53%, to 19.2 million.2
In 2025, 70% of survivors in the United States have lived 5+ years since their diagnosis.1
In 2025, 49% of survivors in the United States have lived 10+ years since their diagnosis.1
In 2025, 22% of survivors in the United States have lived 20+ years since their diagnosis.1

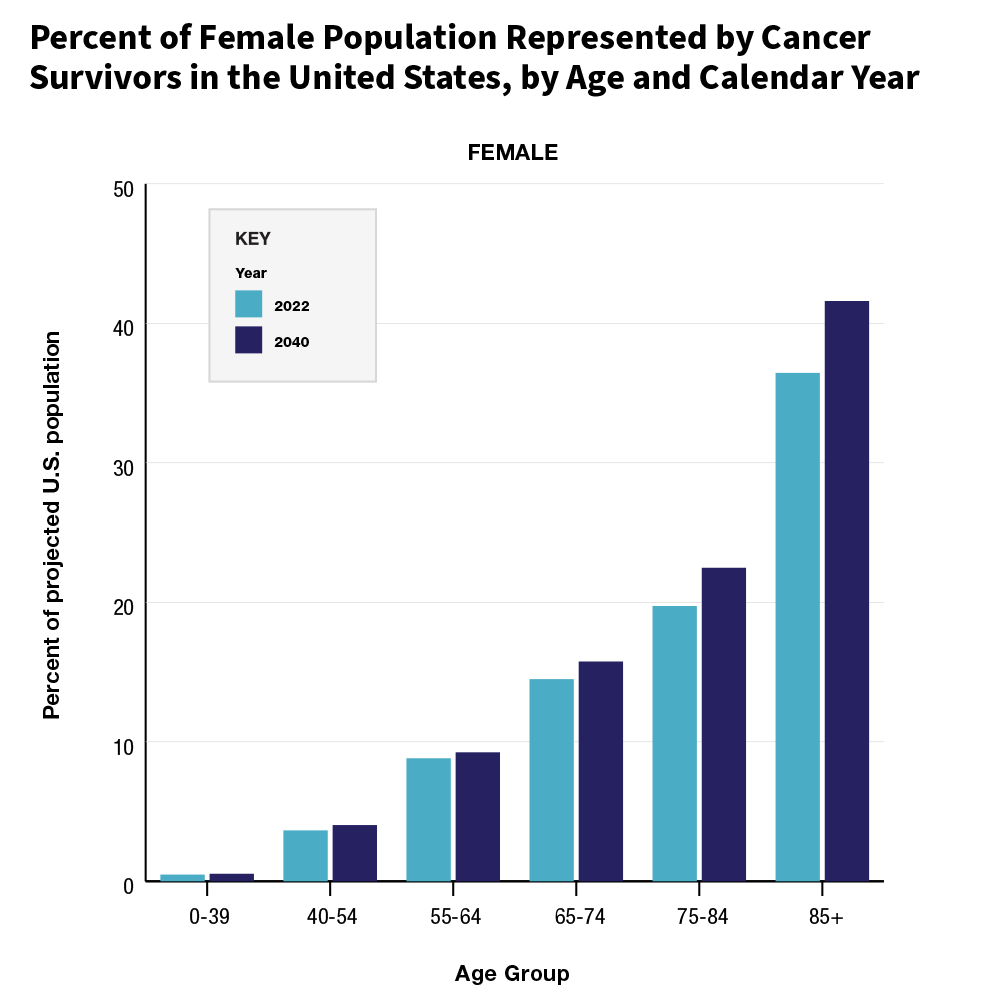
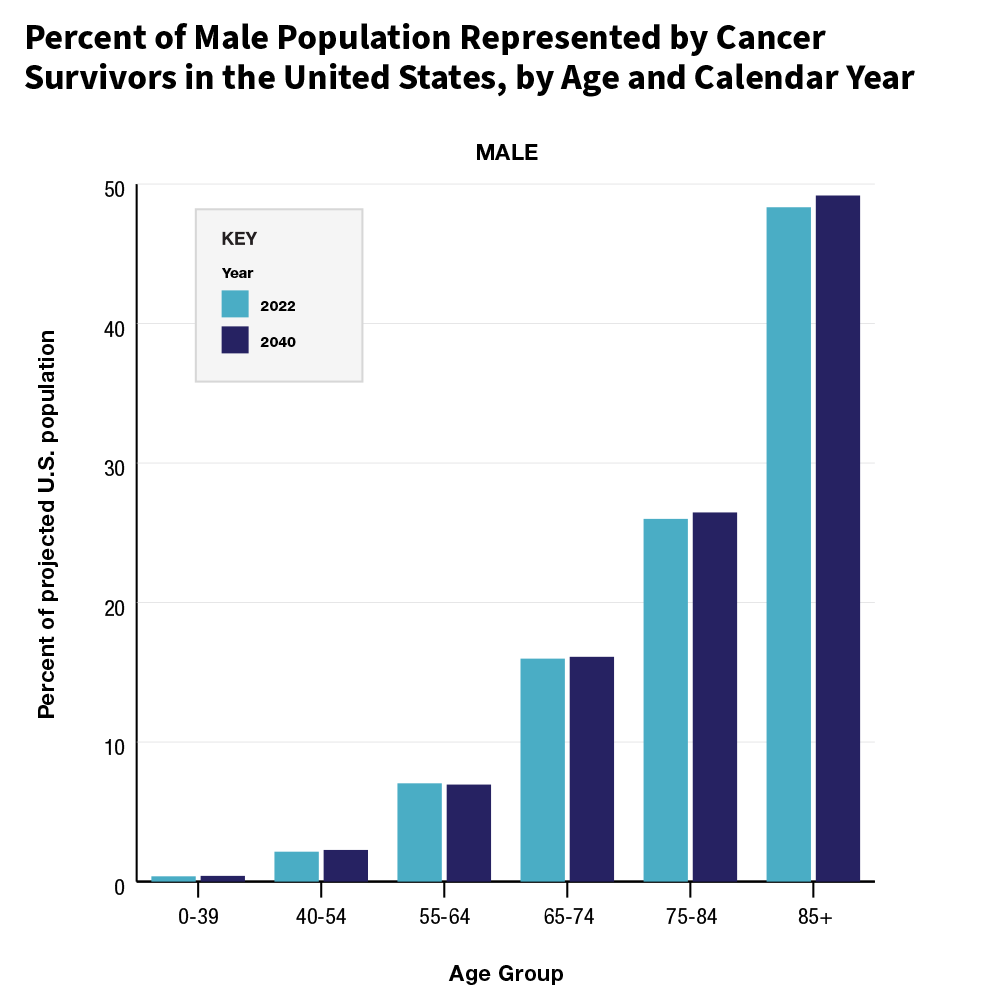
In 2025, 79% of cancer survivors currently living in the United States are age 60 or older.1
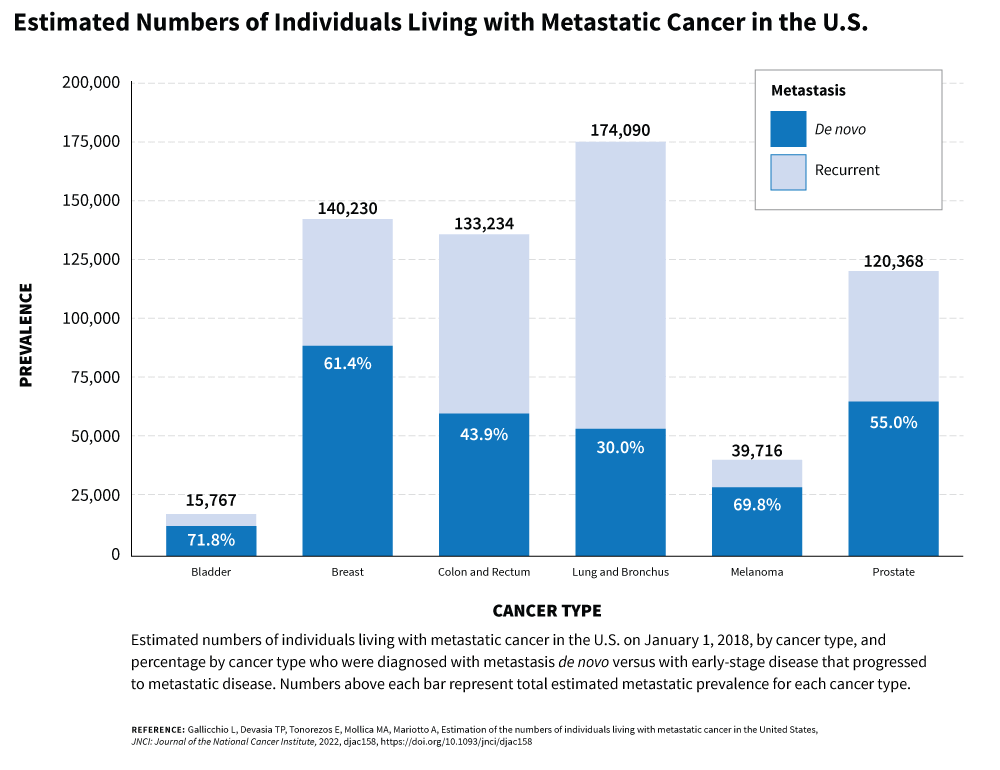
In 2018, there were 623,405 people living with metastatic breast, prostate, lung, colorectal, or bladder cancer or metastatic melanoma in the United States. That number has been estimated to increase to over 693,400 by 2025.3

Female breast cancer survivors represent 23% of cancer survivors in the United States, or 4.3 million people.* 1

Prostate cancer survivors represent 19% of cancer survivors in the United States, or 3.6 million people.* 1

Melanoma survivors represent 9% of cancer survivors in the United States today, or 1.6 million people.* 1

Colorectal cancer survivors represent 8% of cancer survivors in the United States, or 1.4 million people.* 1
* Note: People may be represented more than once in these percentages if they have been diagnosed with more than one cancer. For example, a man who has survived both colorectal cancer and prostate cancer will be included as both a colorectal cancer survivor and as a prostate cancer survivor. Therefore, the sum of the percentages may be more than 100%.
1Wagle NS, Nogueira L, Devasia TP, et al. Cancer treatment and survivorship statistics, 2025. CA Cancer J Clin. 2025 Jul-Aug;75(4):308-340. doi: 10.3322/caac.70011. Epub 2025 May 30.
2Tonorezos E, Devasia T, Mariotto AB, Mollica MA, Gallicchio L, Green P, Doose M, Brick R, Streck B, Reed C, de Moor JS, Prevalence of Cancer Survivors in the United States, J Natl Cancer Inst. 2024 Nov;116(11):1784–1790. https://doi.org/10.1093/jnci/djae135. Epub 2024 Jul 13.
3Gallicchio L, Devasia TP, Tonorezos E, Mollica MA, Mariotto AB. Estimation of the number of individuals living with metastatic cancer in the United States. J Natl Cancer Inst. 2022 Nov;114(11):1476-1483. doi:10.1093/jnci/djac158. Epub 2022 Aug 22.